New approaches to data & evidence
For the first time ever, London is hosting London Data Week, a festival of events and exhibitions for people to learn and talk about how data can influence London for the better. At PRD we rely extensively on high-quality data to inform the work we do, so to contribute to the discussion, we’ll be publishing a series of journal entries to share our experiences with and ambitions for data in London and beyond.
We are living through unprecedented and uncertain times. We can take nothing for granted and will need to design bold new systems, approaches and projects if we are to tackle the big societal challenges of the day.
Doing this will require testing new scenarios, lobbying for new behaviours and challenging what we value. None of this can be achieved without good evidence and data. However, we are still too reliant on information that is inaccurate or out of date. This includes government data sources which rely heavily on assumptions as well as approaches to social value driven by information that is neither empirically nor locally derived.
Bad information begets bad planning and poor investment decisions. In the current climate this can be especially dangerous, leading to a scenario where we fail to make the right decisions in our responses to climate breakdown, the cost of living and the housing crisis. We need to drive much better standards of evidence to help us build a better future.
PRD takes evidence and data seriously. We are investing in new processes and continually innovating, whether through the London High Streets Data Service, which we have helped establish; by developing an open access Cost of Living calculator to help understand the experience of poverty and inequality; or by developing new ways of thinking about social foundations using primary research in East London. Below, we share a couple recent projects with new approaches to evidence.
Local data & views to understand the lived experience of housing in Waltham Forest
PRD is working with the London Borough of Waltham Forest to support the findings of an independent Affordable Housing Commission. The council wanted external expert scrutiny to understand what it can do to accelerate the delivery of more genuinely affordable homes. PRD provided a wealth of contemporary evidence tracking the impact of development over the last decade to support the recommendations of the Commission. Our approach relied on granular data, which we tested and validated through resident engagement.
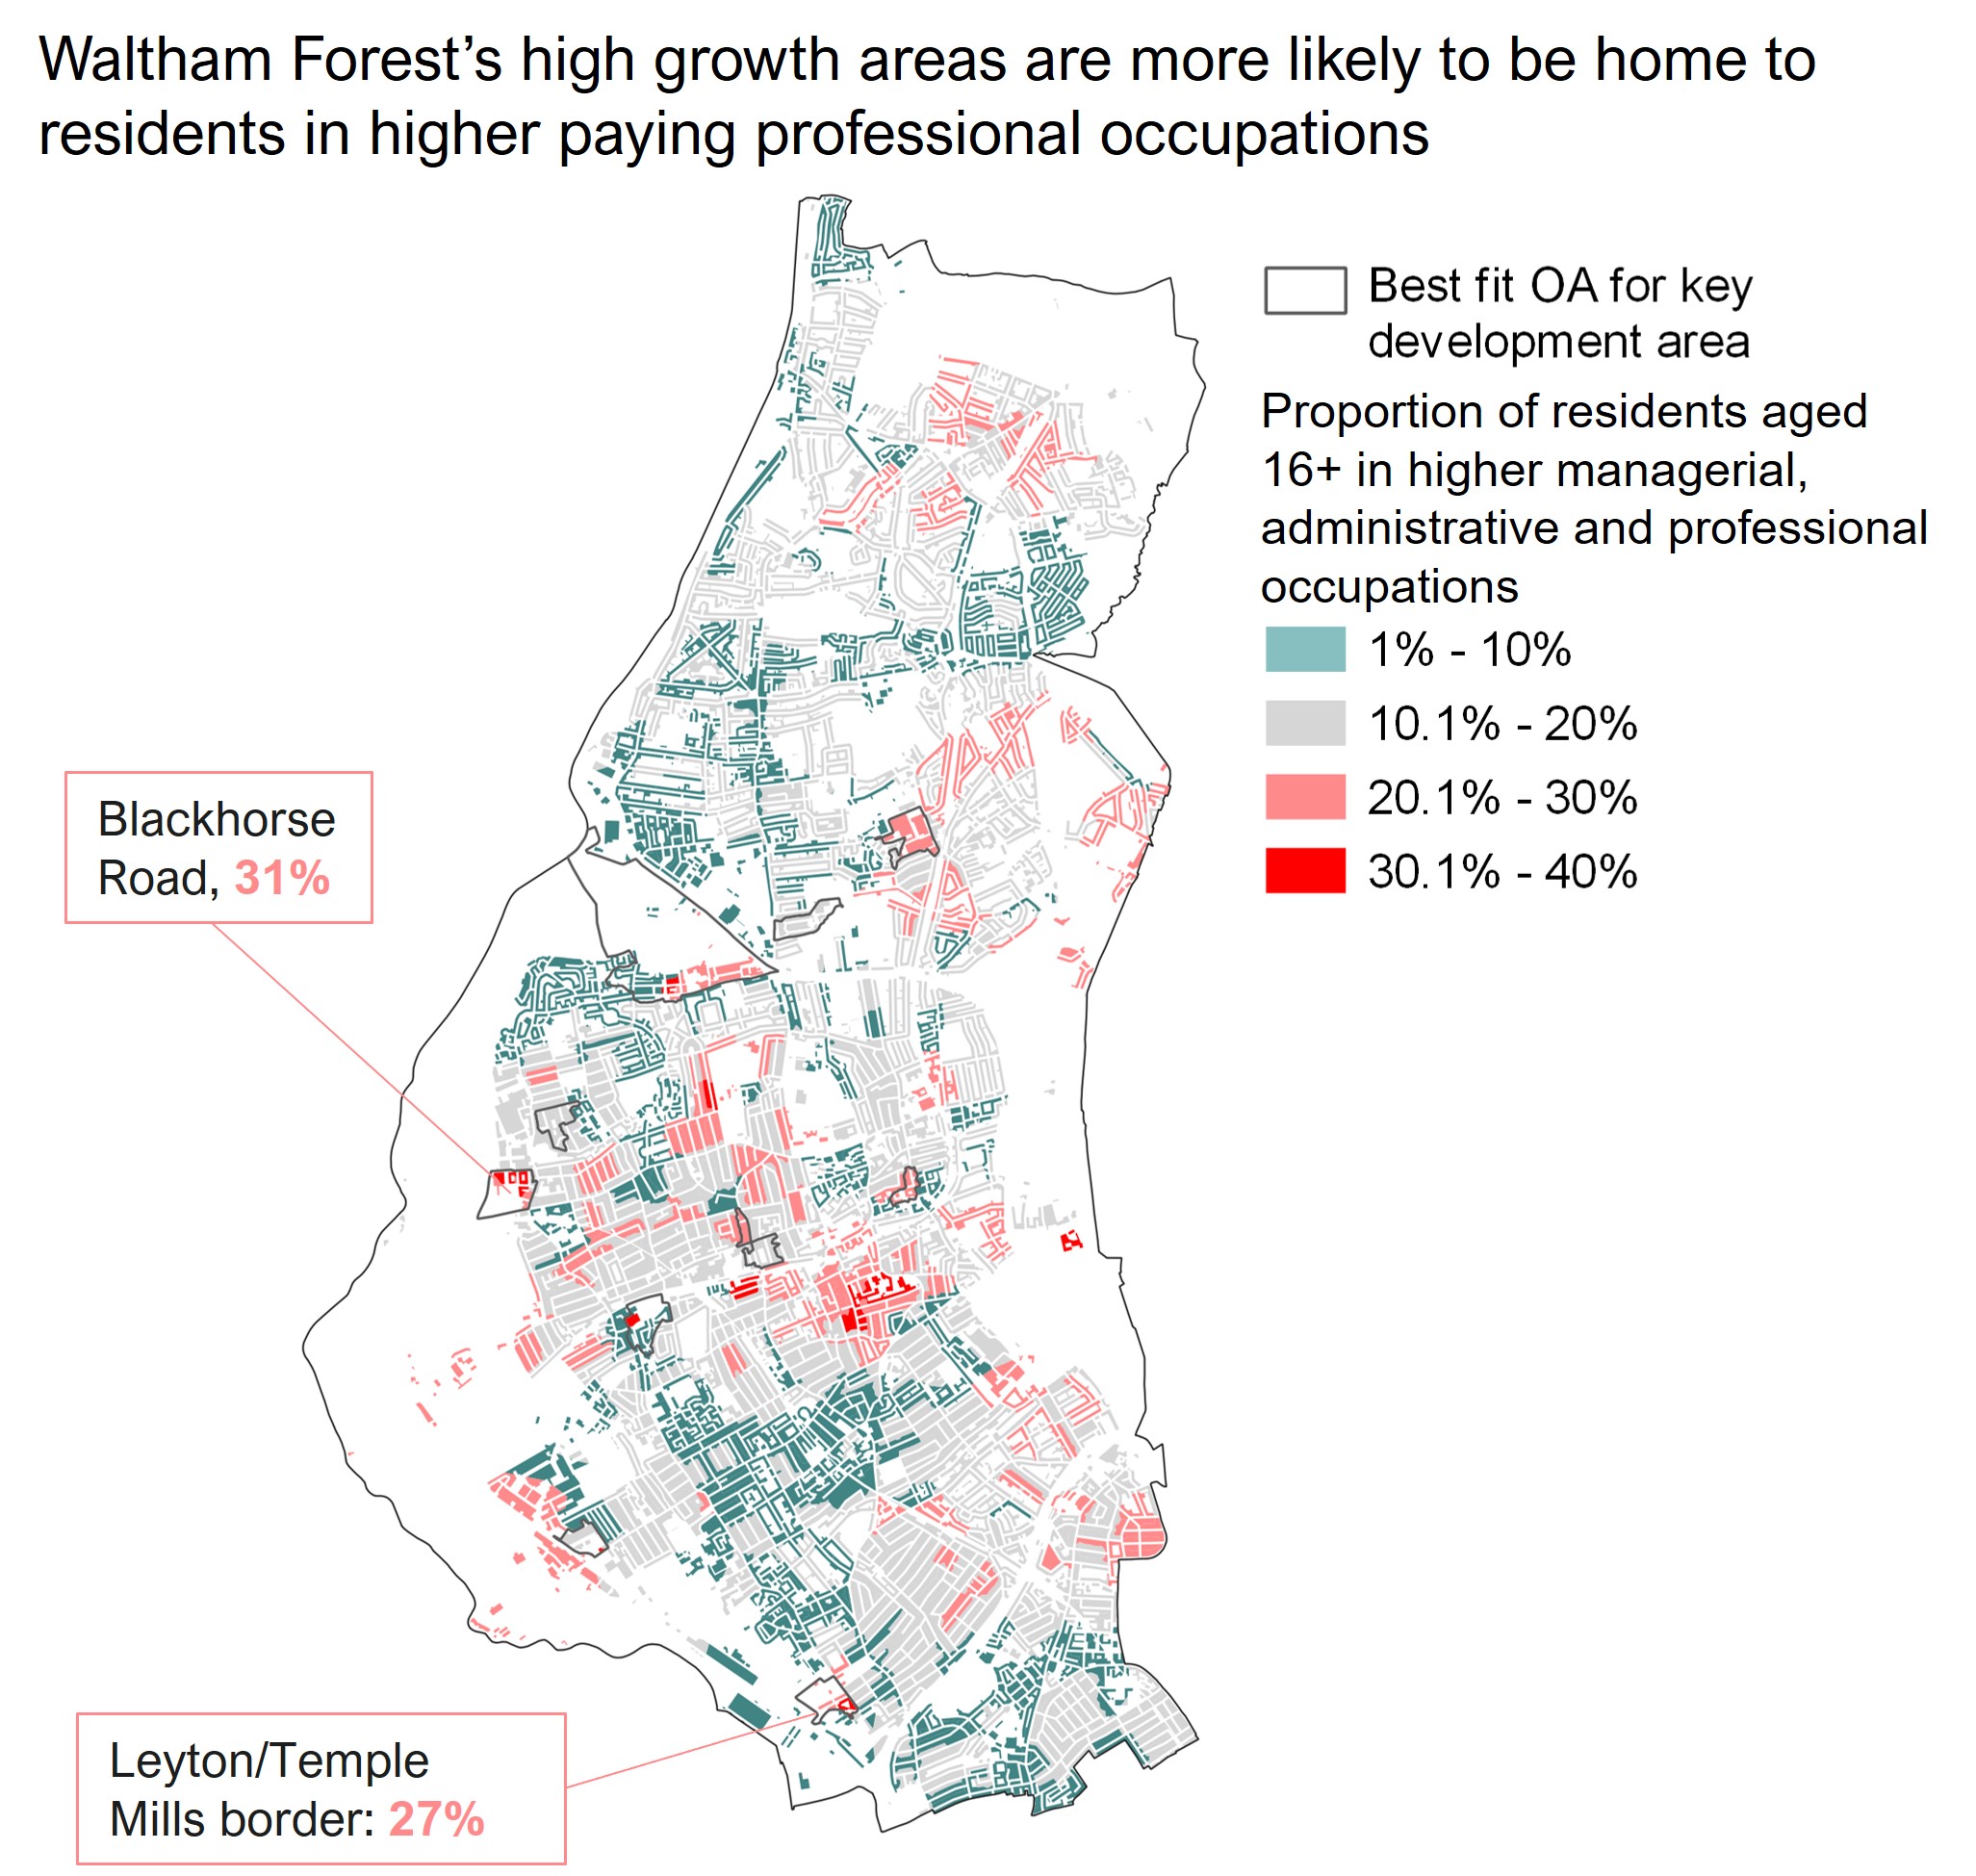
Waltham Forest is one of the most rapidly changing boroughs in London, having the fastest house price growth since 2012. Using the Planning London Datahub, PRD identified the neighbourhoods within the borough that had seen the most housing development over the last ten years. From this, we used Census data to compare differences between 2011 and 2021, showing how the borough’s demographics have changed and the contribution of new housing development towards these changes. The granularity of the Census enabled a detailed understanding of changes at development level in areas of highest housing growth. This provided deep insight into who had moved into new homes and the role that tenure (affordable vs market housing) played in these changes.
We supplemented the data analysis with a programme of in-depth focus groups in five of the areas with the most development, which helped to test the quantitative data and understand how people experienced area change and the housing crisis on the ground. Marrying good data with rich qualitative evidence provided a deep understanding of the role of development in the borough’s growth story over the last ten years and communities’ experience of rapid change.
New ways of measuring deprivation in the Thames Estuary
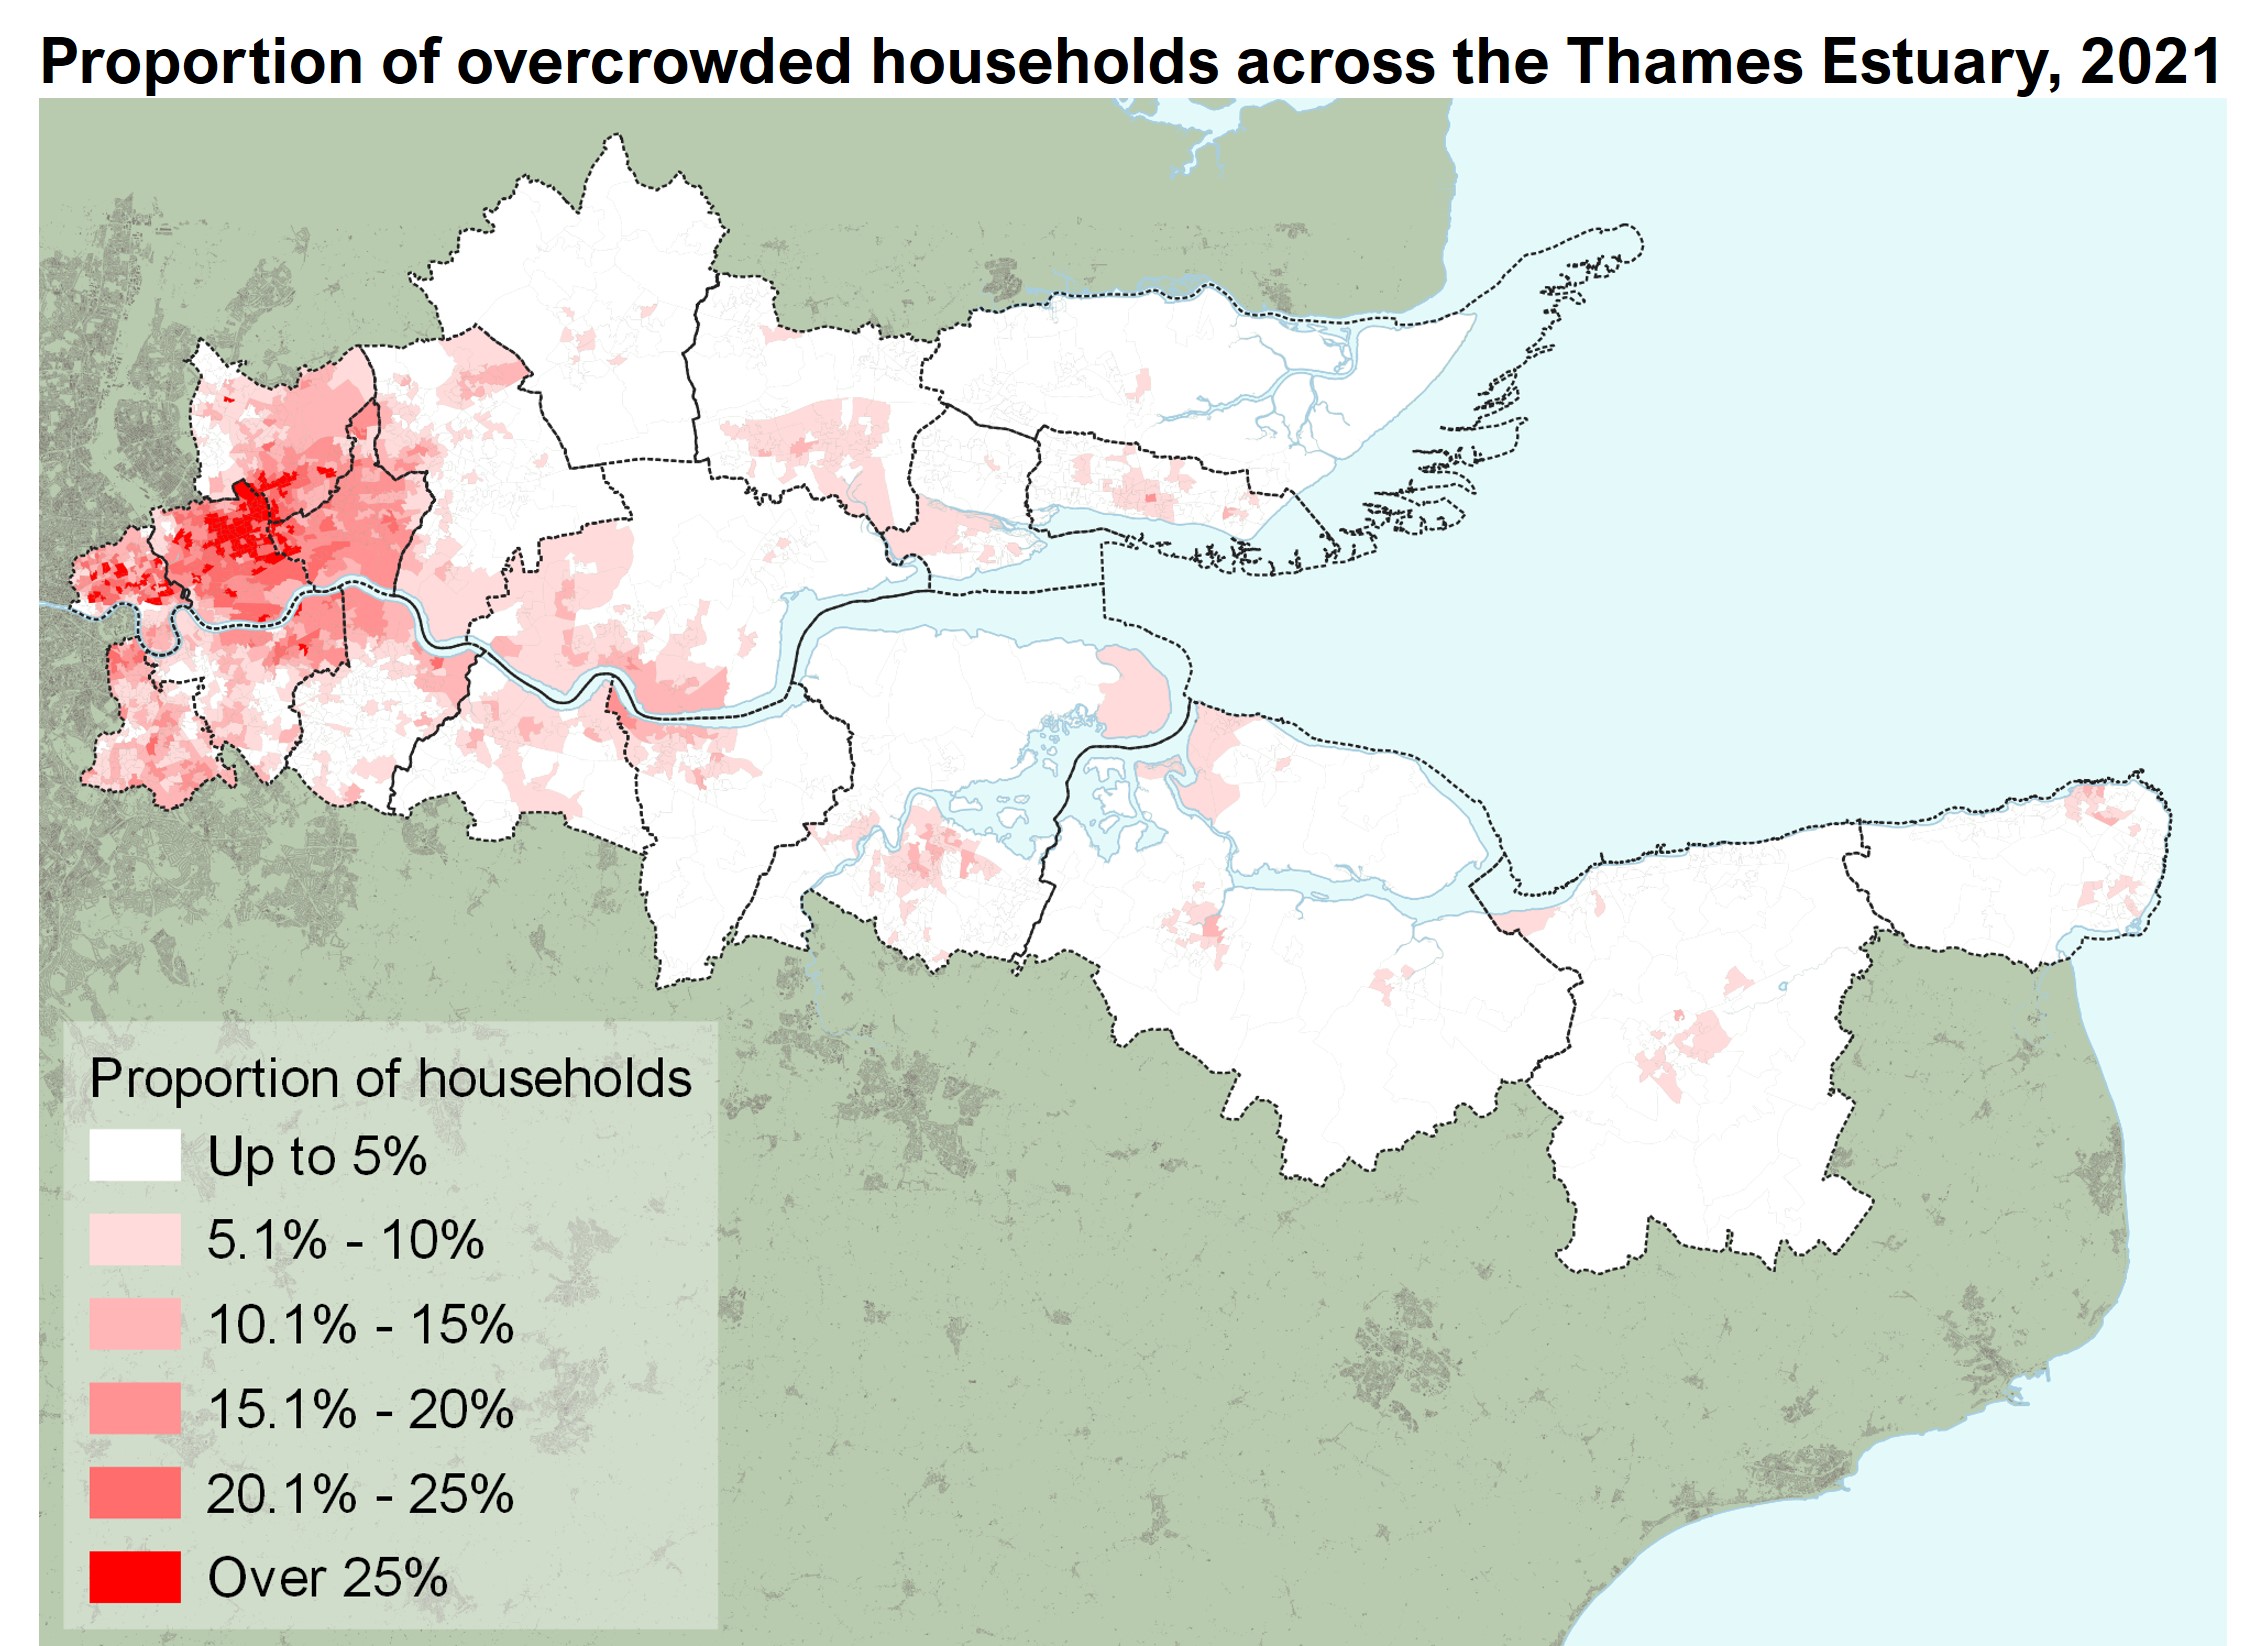
Bringing together datasets in an innovative way has been essential in our work alongside Chris Clarke with the Thames Estuary Growth Board, where we are looking to increase understanding of deprivation across the Estuary and identify communities where investment should be focused.
The Thames Estuary is a large and diverse area which includes urban areas of East London, coastal towns such as Margate and Southend-on-Sea and rural communities on the Hoo peninsula. This makes measuring deprivation complex, as residents across the region are facing very different barriers to opportunity. Traditional metrics like the Indices of Multiple Deprivation do not capture the different challenges faced by residents, and with the last update in 2019, circumstances will have changed through Covid and the current cost of living crisis.
Alongside quantitative data, qualitative research is essential to understanding local experience, but choosing areas to focus on with such a large geography is difficult.
Within this context, we developed our own measure of deprivation based on three themes taken from the Levelling Up White Paper:
- Productivity, pay, jobs and living standards
- Opportunity and public services
- Community, pride, belonging
Against each theme, we identified multiple publicly available datasets through which we could assess neighbourhood performance, for example information on poor health, qualifications, children in absolute poverty, and economic inactivity.
Using this measure has allowed us to explore the different types of deprivation across the region and to identify individual neighbourhoods where deprivation is most acute. These will be the focus of our qualitative work, where we will have in-depth conversations with residents to understand their experiences.
– By Chris Paddock, Will Temple, and Rose Jump. Contact them to learn more about these projects.