London, let’s talk dirty
For the first time ever, London is hosting London Data Week, a festival of events and exhibitions for people to learn and talk about how data can influence London for the better. At PRD we rely extensively on high-quality data to inform the work we do, so to contribute to the discussion, we’ll be publishing a series of journal entries to share our experiences with and ambitions for data in London.
Waste flow is the sort of topic that is often far off the radar when it comes to regeneration and economic development—but as an absolutely critical function of cities and a trove of resources, it needs to be embedded in how we think about the economy.
Recently, we’ve started incorporating the Environment Agency’s immense Waste Data Interrogator into our evidence bases. The Waste Flow Interrogator provides data collected from waste facilities throughout England, with details on the waste origin, type of waste (e.g. construction waste, chemical waste), ‘fate’ of waste (e.g. incinerated and used for energy, sent to landfill) and tonnes. Using this tool allows us to understand, down to local authority level, how much waste a place receives in a given year and what happens to it. It is a useful starting point for discussions about transforming economies from linear to circular.
Let’s take a look at what it can tell us about London’s waste.
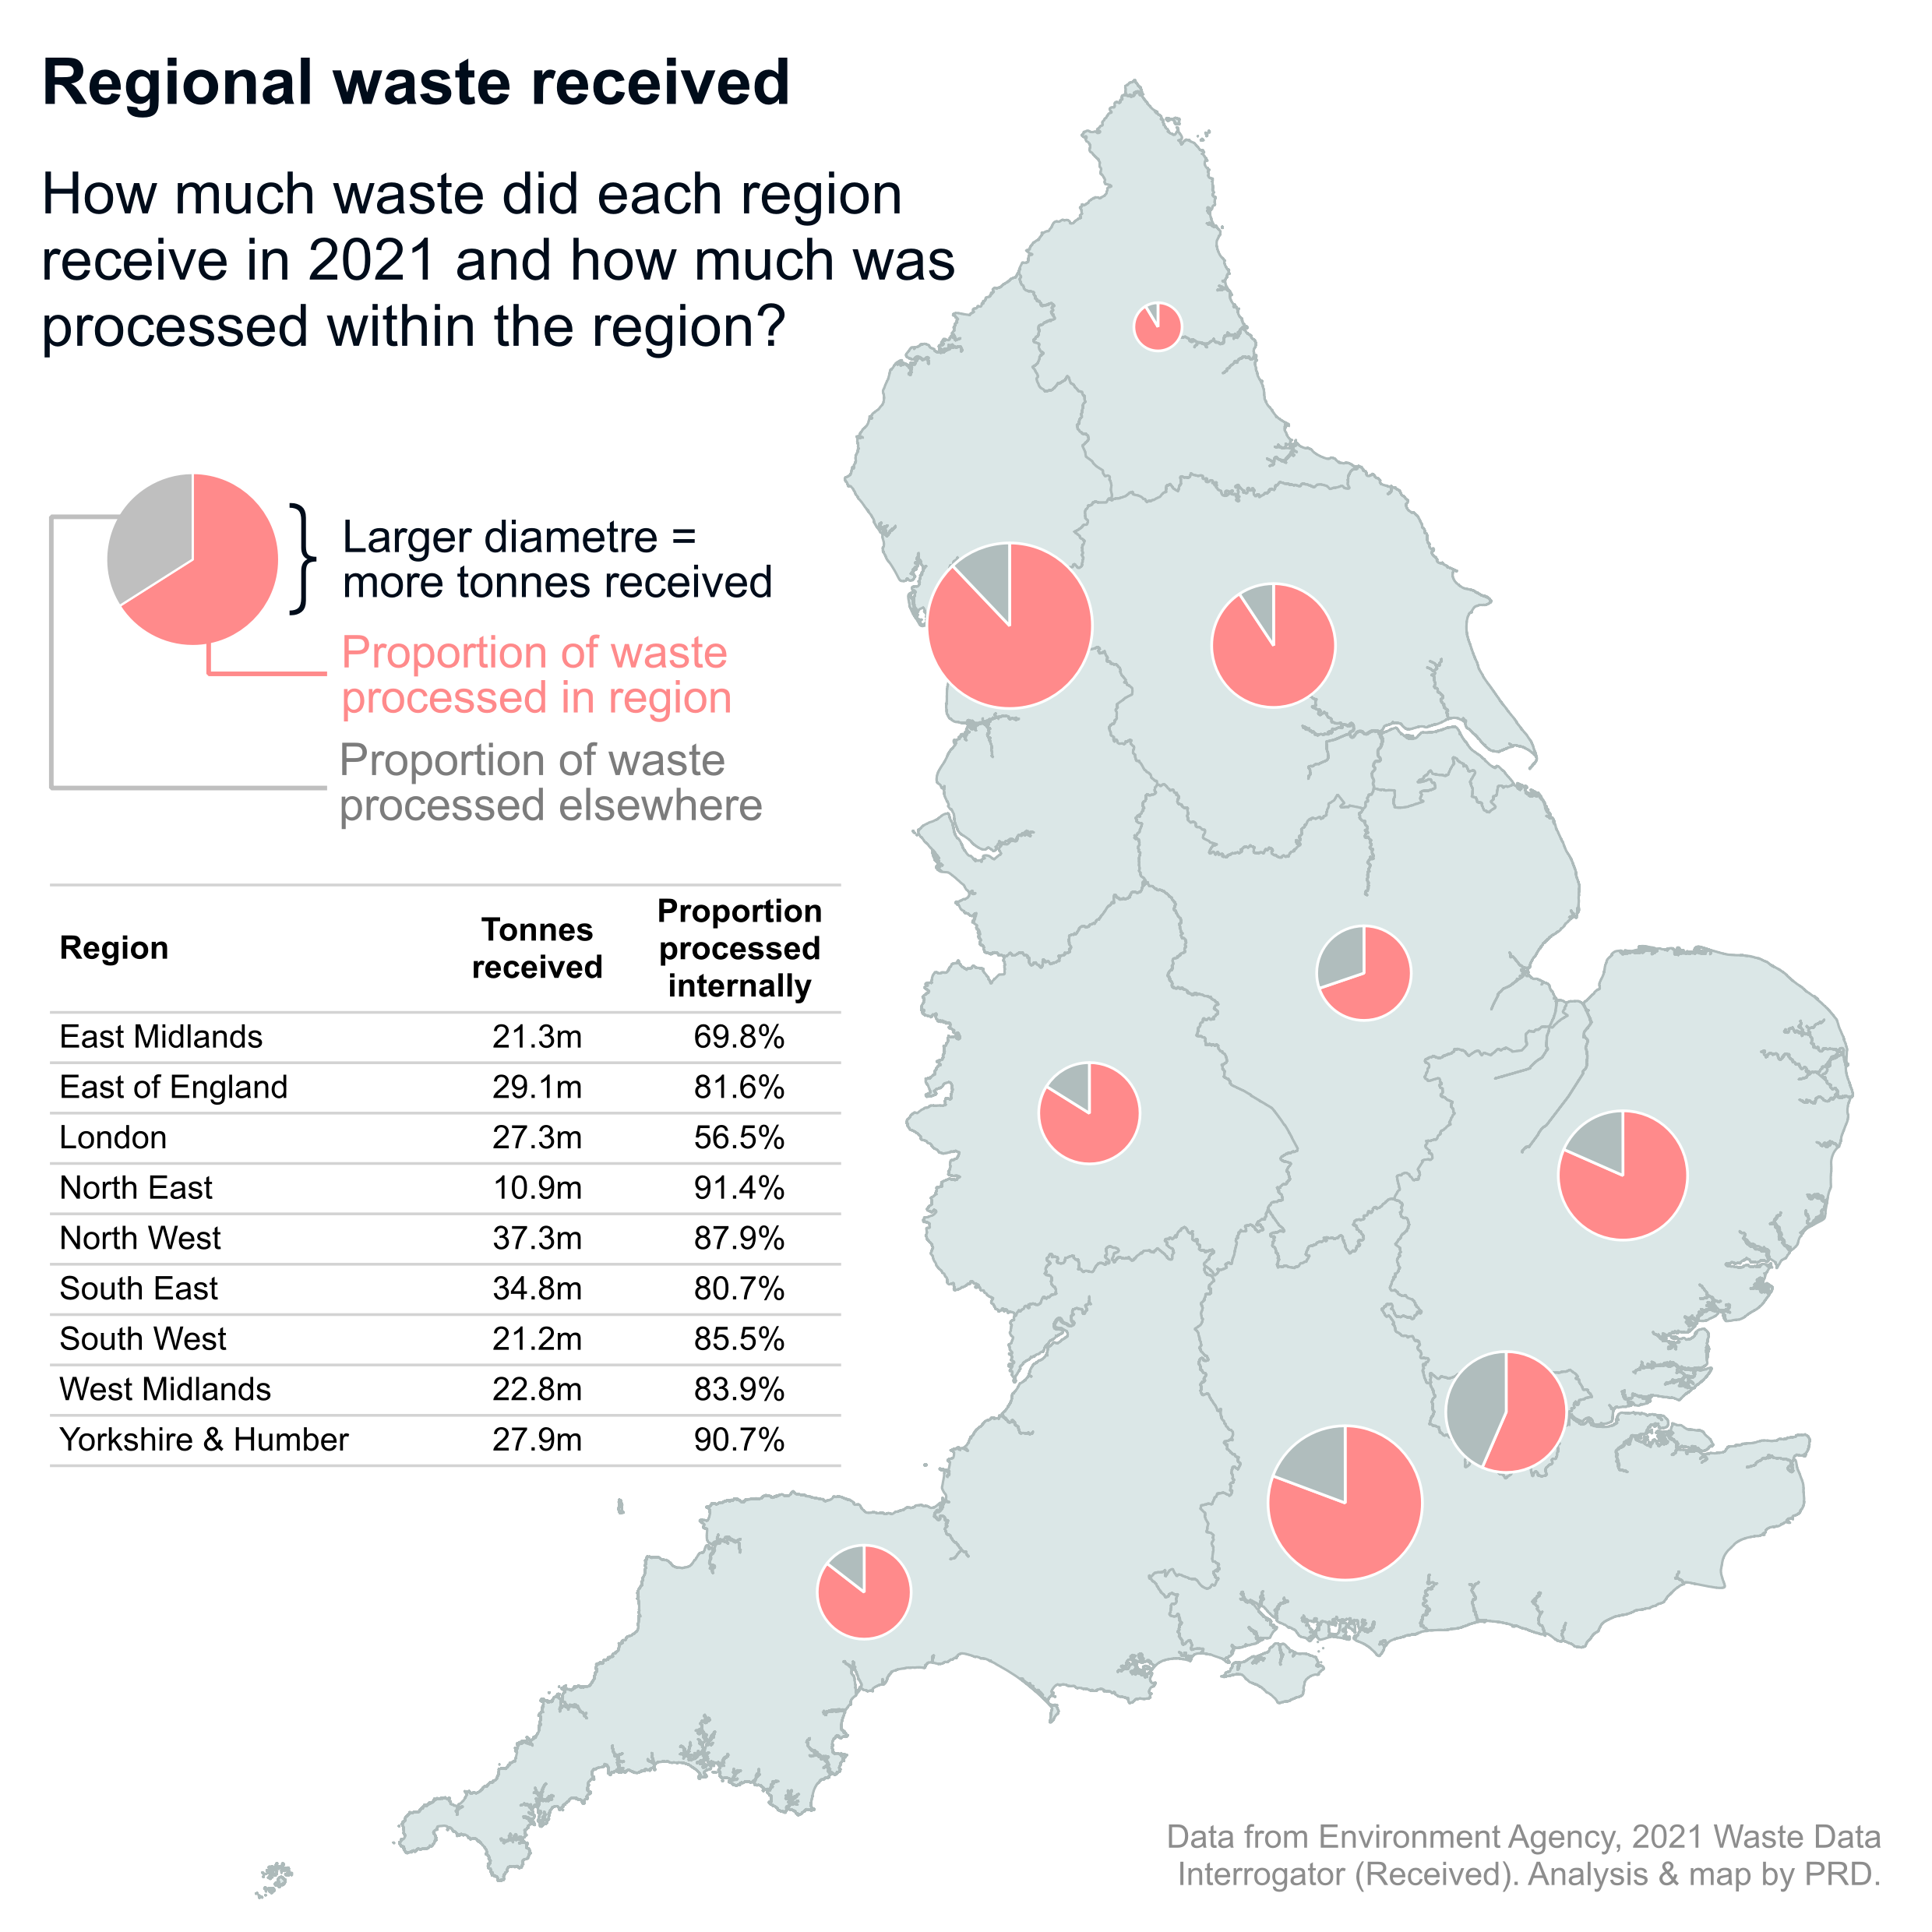
Among England’s regions, London processes the lowest proportion of its received waste within its borders
Below, we can see the total amount of all waste types received in each region in 2021. London receives an average amount of waste. We can also see how much of the waste each region receives is processed at facilities within that same region. Only around half of the waste London receives, 56.5% or 15m tonnes, is processed within the city, which is significantly lower than other regions. This could be because, as a highly built-up region, London doesn’t have suitable space for waste processing, and because certain types of waste need specialist treatment that is only provided by facilities elsewhere in the country.
Note that this data doesn’t account for waste exported to other parts of the UK or other countries. The UK exported nearly half a million metric tons of plastic waste in 2022, with Turkey being the top destination. London was certainly a contributor to that figure.
This means that:
- The carbon footprint of transporting nearly 15m tonnes of waste out of London using roads will be significant.
- Electric lorries could be one solution to minimise impact, but they still rely on mining extensive amounts of raw materials for batteries and on green energy sources being widely available. Resource degradation and road congestion are inevitable consequences. Developing solutions, such as consolidated waste hubs, moving waste by rail or eco-friendly barges, or incorporating reverse logistics principles into waste management—for example taking waste somewhere and returning the vehicle with products for use or sale in London—are alternatives that should be considered in London’s strategic planning.
- There is a missed opportunity to use decentralised and regenerative practices to improve local waste processing. Treating waste locally would reduce the amount of waste production in London in general, thereby reducing the need to export it elsewhere. This can further provide opportunities to change our individual relationships with waste, starting to see it as a valuable resource, and bringing responsibility into our personal actions.
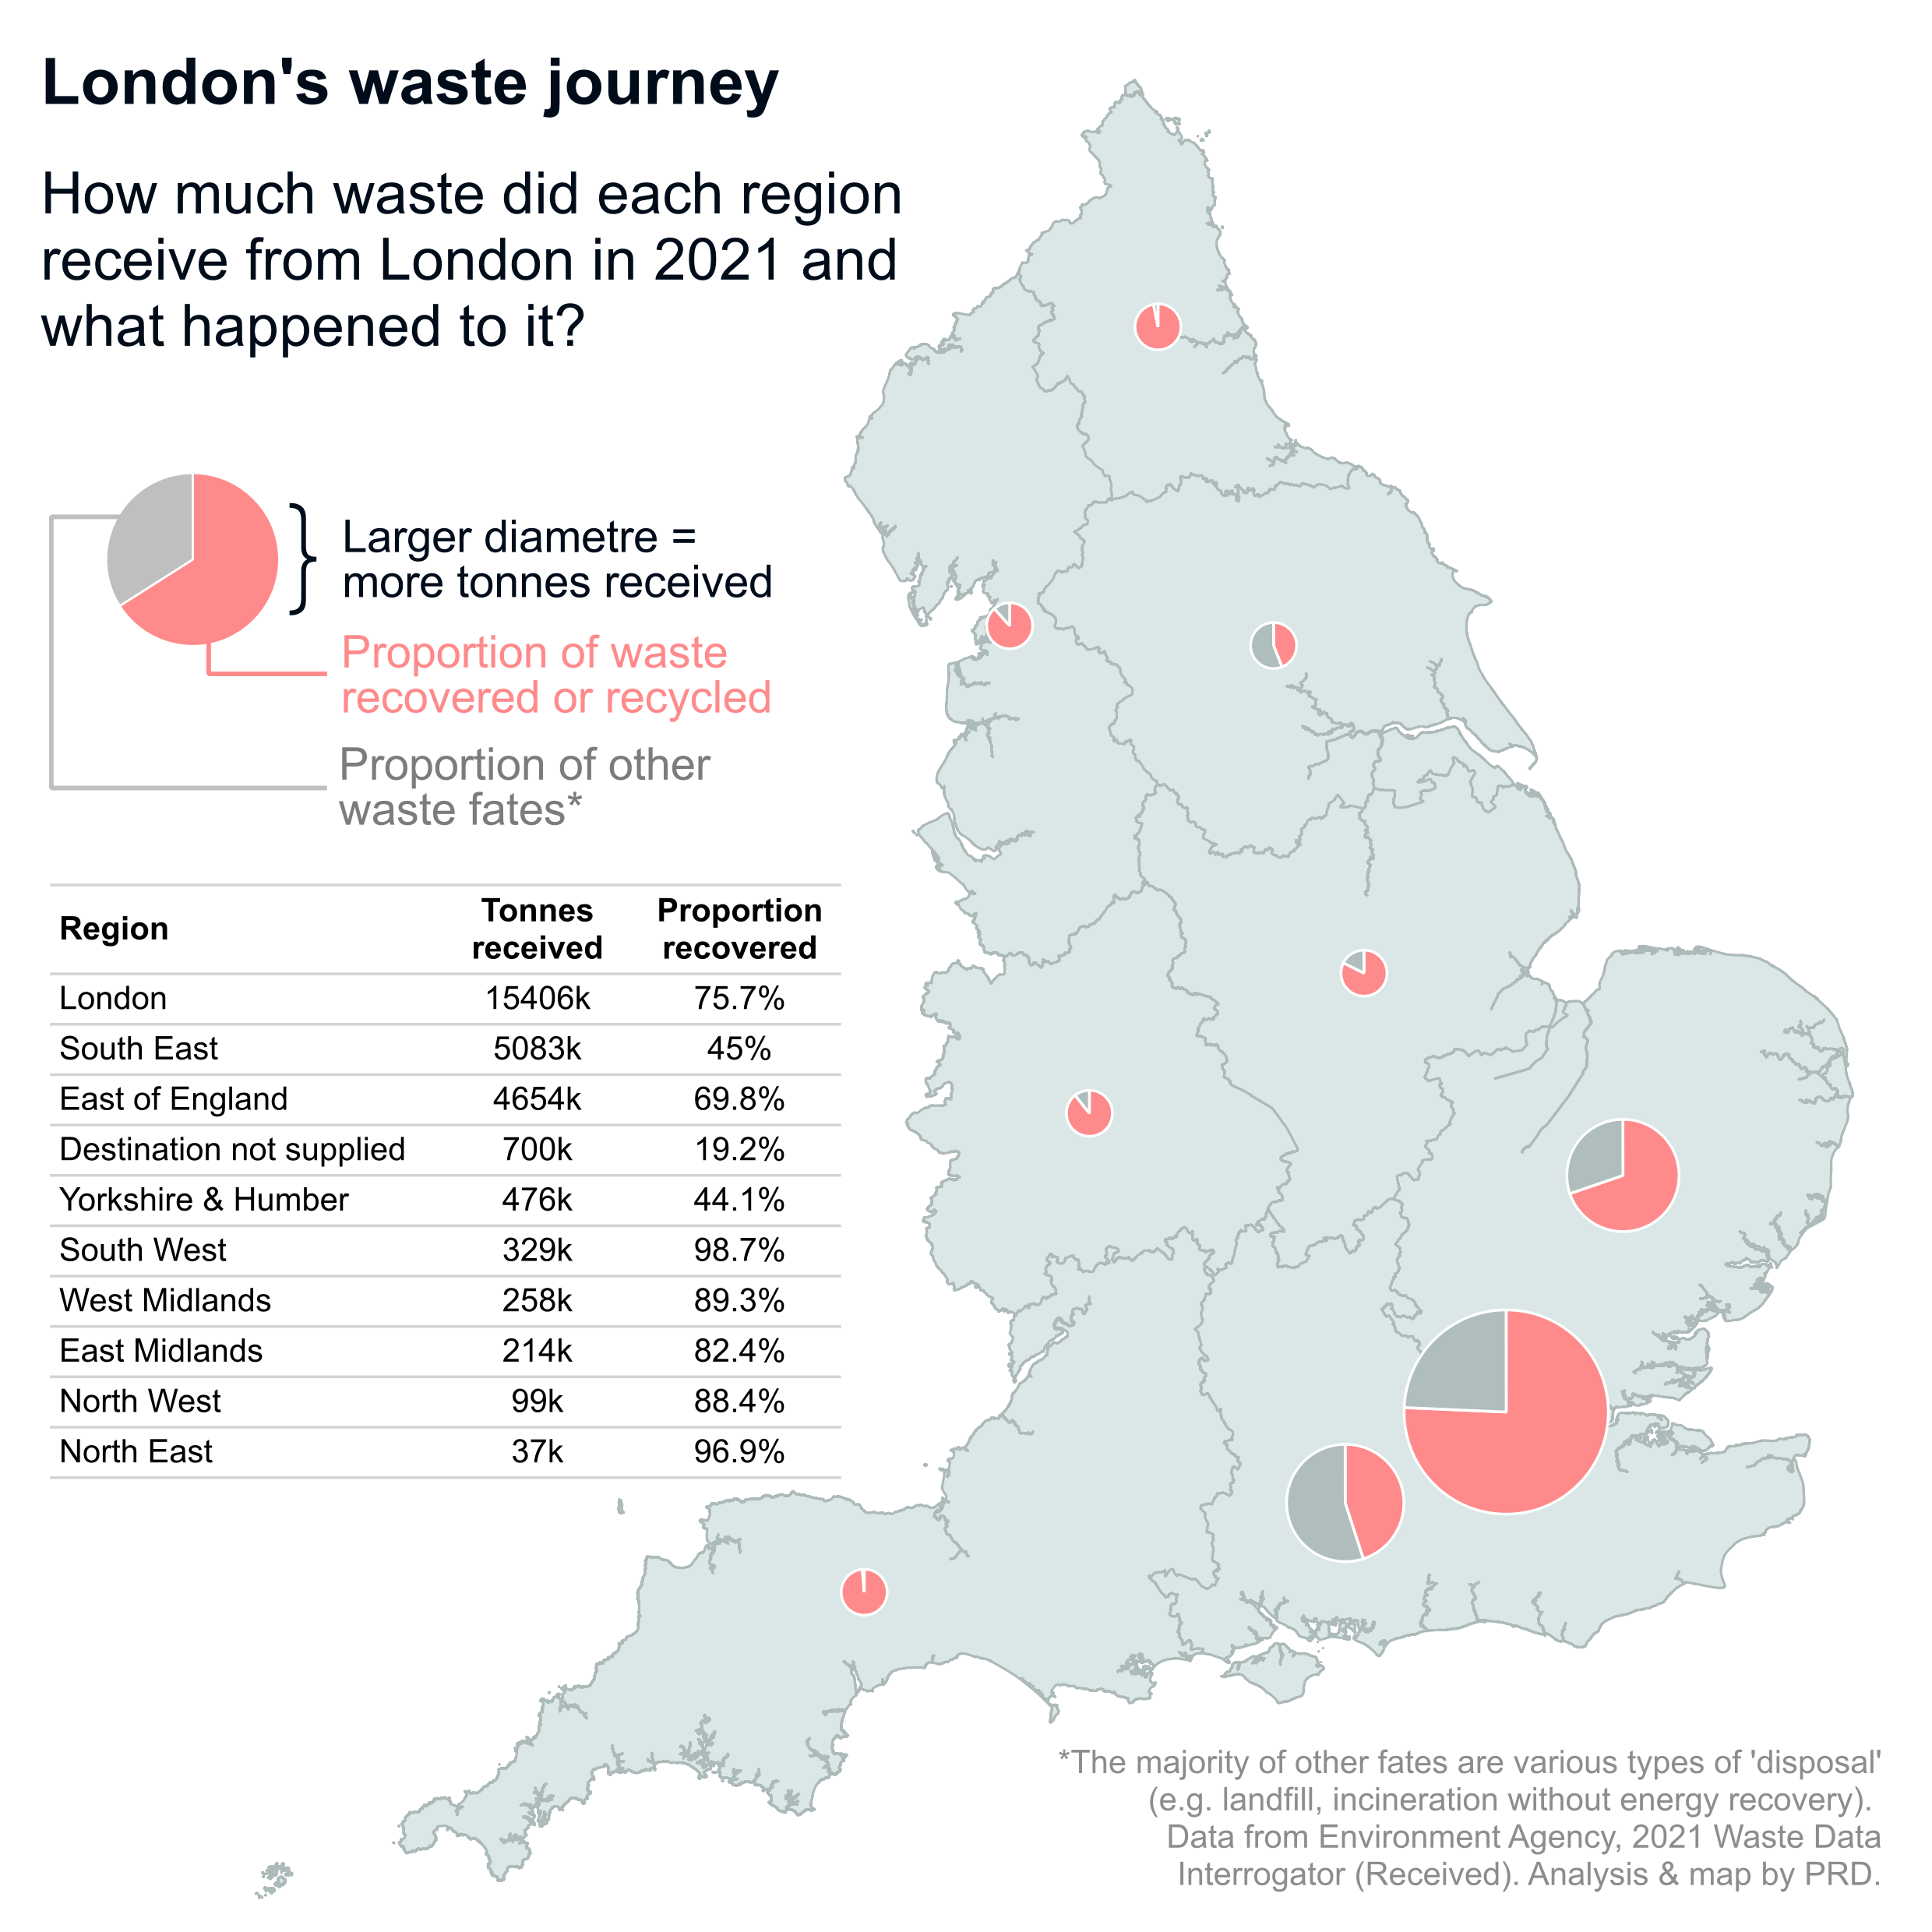
London recovers 3/4 of its own waste, but recovery rates are lower for waste transferred to other regions
Now we’ll focus on what happens to the waste various regions receive from London: in other words, the 15m tonnes London receives from its own boroughs (the pink part of the London circle in the map above) and the 12m tonnes going to other regions (the grey part of the London circle in the map above). As before, this data doesn’t account for waste going from London to Wales, Scotland, Northern Ireland, or other countries.
Of the 15m tonnes of waste that comes from London boroughs, there is a relatively high recovery rate of 76%. Much of London’s waste goes to the South East or East of England; combined, the two regions receive 36% of London’s waste, albeit with vastly different recovery rates (45% in the South East vs 70% in the East of England). ‘Recovered’ means fates such as reclamation of materials or reused to generate energy (e.g. producing heating for buildings from incineration). Other fates are largely various types of ‘disposal’, such as landfill or incineration without energy capture.
While an intra-London recovery rate of 76% may seem significant, we shouldn’t be under the impression that we don’t need to take more action:
- Much of that recovery happens through recycling (e.g. waste to energy, transforming waste into new products for reuse). While recycling is an important part of the waste management process, it misses one of the core principles of circularity: prolonging the life of materials at their highest value. Shifting to refurbishing and upcycling practices will ensure the value of materials stays in the loop for longer and reduces the pressure on virgin materials and the impact on environmental degradation.
- There is wide scope to expand waste recovery methods to reach the 25% of waste that London does not recover internally. Improving the sharing economy, reusing materials through innovative practices, and composting are some routes that should be explored. This would help transform waste into valuable materials, promote circular practices, and foster local ecosystems among businesses and communities.
- Waste going to other regions (i.e. excluding London) has an overall lower recovery rate of just 47%, which could be improved through some of the above measures.
Breaking down London’s waste flow
Finally, we have an alluvial diagram to illustrate London’s material flow, taking into account the regions receiving London’s waste, the type of waste, and the waste’s fate. The size of the ‘flows’ corresponds to the tonnage per category.
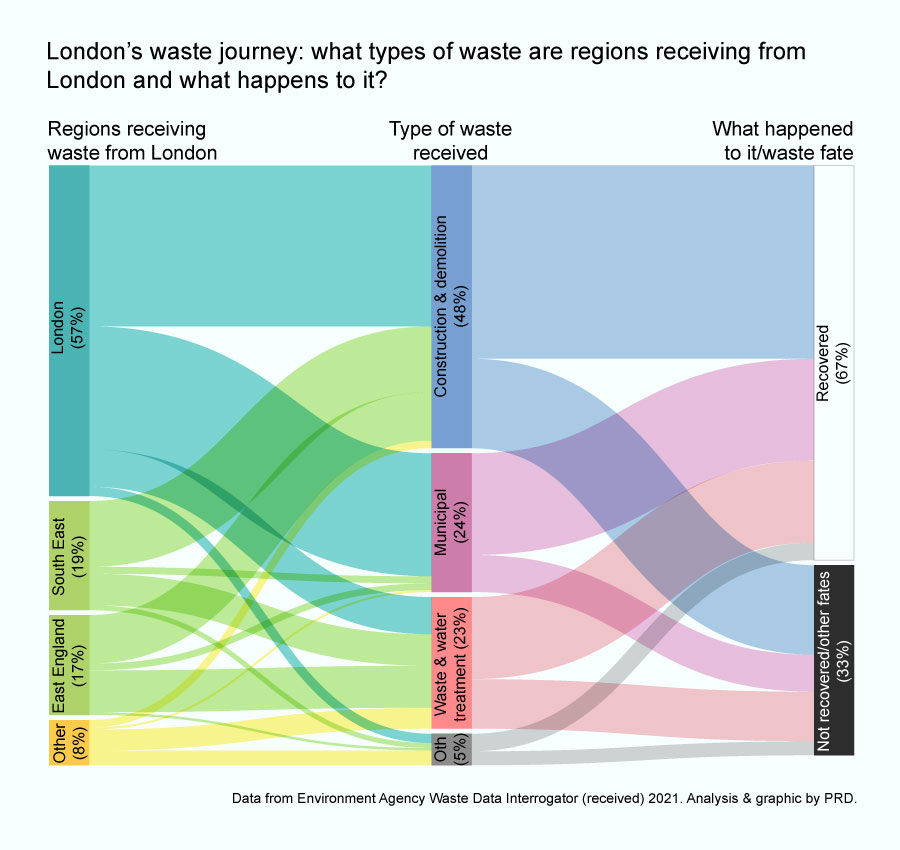
The construction sector presents a huge opportunity for circularity. Nearly half of London’s waste (48%) comes from construction and demolition activities, a sector responsible for generating around 60% of waste in the UK—and around 1/3 of London’s construction waste is not recovered, partially due to challenges around material reuse regulations, testing, certification and standardisation. Circular Construction Hubs could be spread across London, in areas with predicted significant development, to provide solutions for salvaging and reusing construction components.
There is also scope to improve municipal waste recovery, a strand that directly relates to resident, business, and consumer behaviours. Continuous engagement, awareness and education programmes are key to ensuring recovery initiatives grow in this area. Developing creative programmes with schools, young people, communities, and businesses, and focusing on materials closer to our day-to-day lives like single use plastics and food waste can be starting points.
Lastly, only 62% of London’s waste produced while treating waste—for example, in sewage treatment this might be human waste (which gets treated into ‘sludge’), wet wipes wrongly put down the toilet, grit that gets washed into the sewers from roads, and so on—is recovered. This demonstrates that large waste and water treatment facilities are far from solving our challenges. Opportunities here include investing in decentralised and nature-based solutions, such as constructed wetlands and micro-anaerobic digestors, which can treat waste and wastewater more locally while producing valuable byproducts, such as biofuels.
Final thoughts
Uncovering London’s waste journey is extremely complex. Good data is essential, and material flow analysis is crucial to identifying dependencies and opportunities not visible at first glance. It helps to demonstrate potential synergies between different flows (such as among the winning trio of waste, food, and energy) and create scope for system changes. Most importantly, it reinforces that, although complex, circularity is richer and far more interesting than the boring linear economy.
– By Carolina Eboli and Amanda Robinson. Contact Carolina to learn more about embedding circular economy principles in your own area or project.