Living conditions and life chances: How deprivation drove voters away from mainstream parties in the May local elections
by Amelia Stewart and Francesca Higginson
It has been argued that in the May 2026 elections, the Greens and Reform made inroads in boroughs with the highest levels of deprivation. Most of these arguments focus on differences in deprivation between boroughs, and less attention has been paid to how deprivation within boroughs shapes how residents vote.
We examine this question by looking at six local authorities that changed administration in May 2026 – Sunderland, Walsall and Havering (where Reform UK won outright council majorities) and Hackney, Waltham Forest and Lewisham (where the Green Party won outright council majorities).
More in Common’s research has found that Reform is over-represented in seats with high levels of employment, health and education deprivation, while Greens perform well in areas with high levels of living environment and income deprivation. We look at whether you see the same trends in deprivation and voting pattern within boroughs as we see between them and what this means for what new administrations may wish to prioritise.
Different domains of deprivation have driven boroughs in different political directions
After the elections, the New Statesman’s Anoosh Chakelian called England a country of “two deprivations”, a characterisation first put forward by political analyst Chris Clarke. Voters in areas of high health, education and employment deprivation are turning to Reform, while those in areas with environment, housing and income deprivation are turning to the Greens. This is backed up by More in Common research, which found that financial insecurity and deprivation are driving voters away from the mainstream to the Greens and Reform, and Green and Reform voters share a loss of faith in Britain’s political institutions.
These two forms of deprivation divide broadly into two groups: deprivation of living conditions and deprivation of life chances. Environment, housing and services deprivation affect our surroundings, whereas health, education and employment deprivation are more personally limiting, and constrain job prospects in particular. It’s no surprise that Reform performs well in constituencies where worklessness is more pronounced, while the Greens perform well in constituencies where in-work poverty is more pronounced.
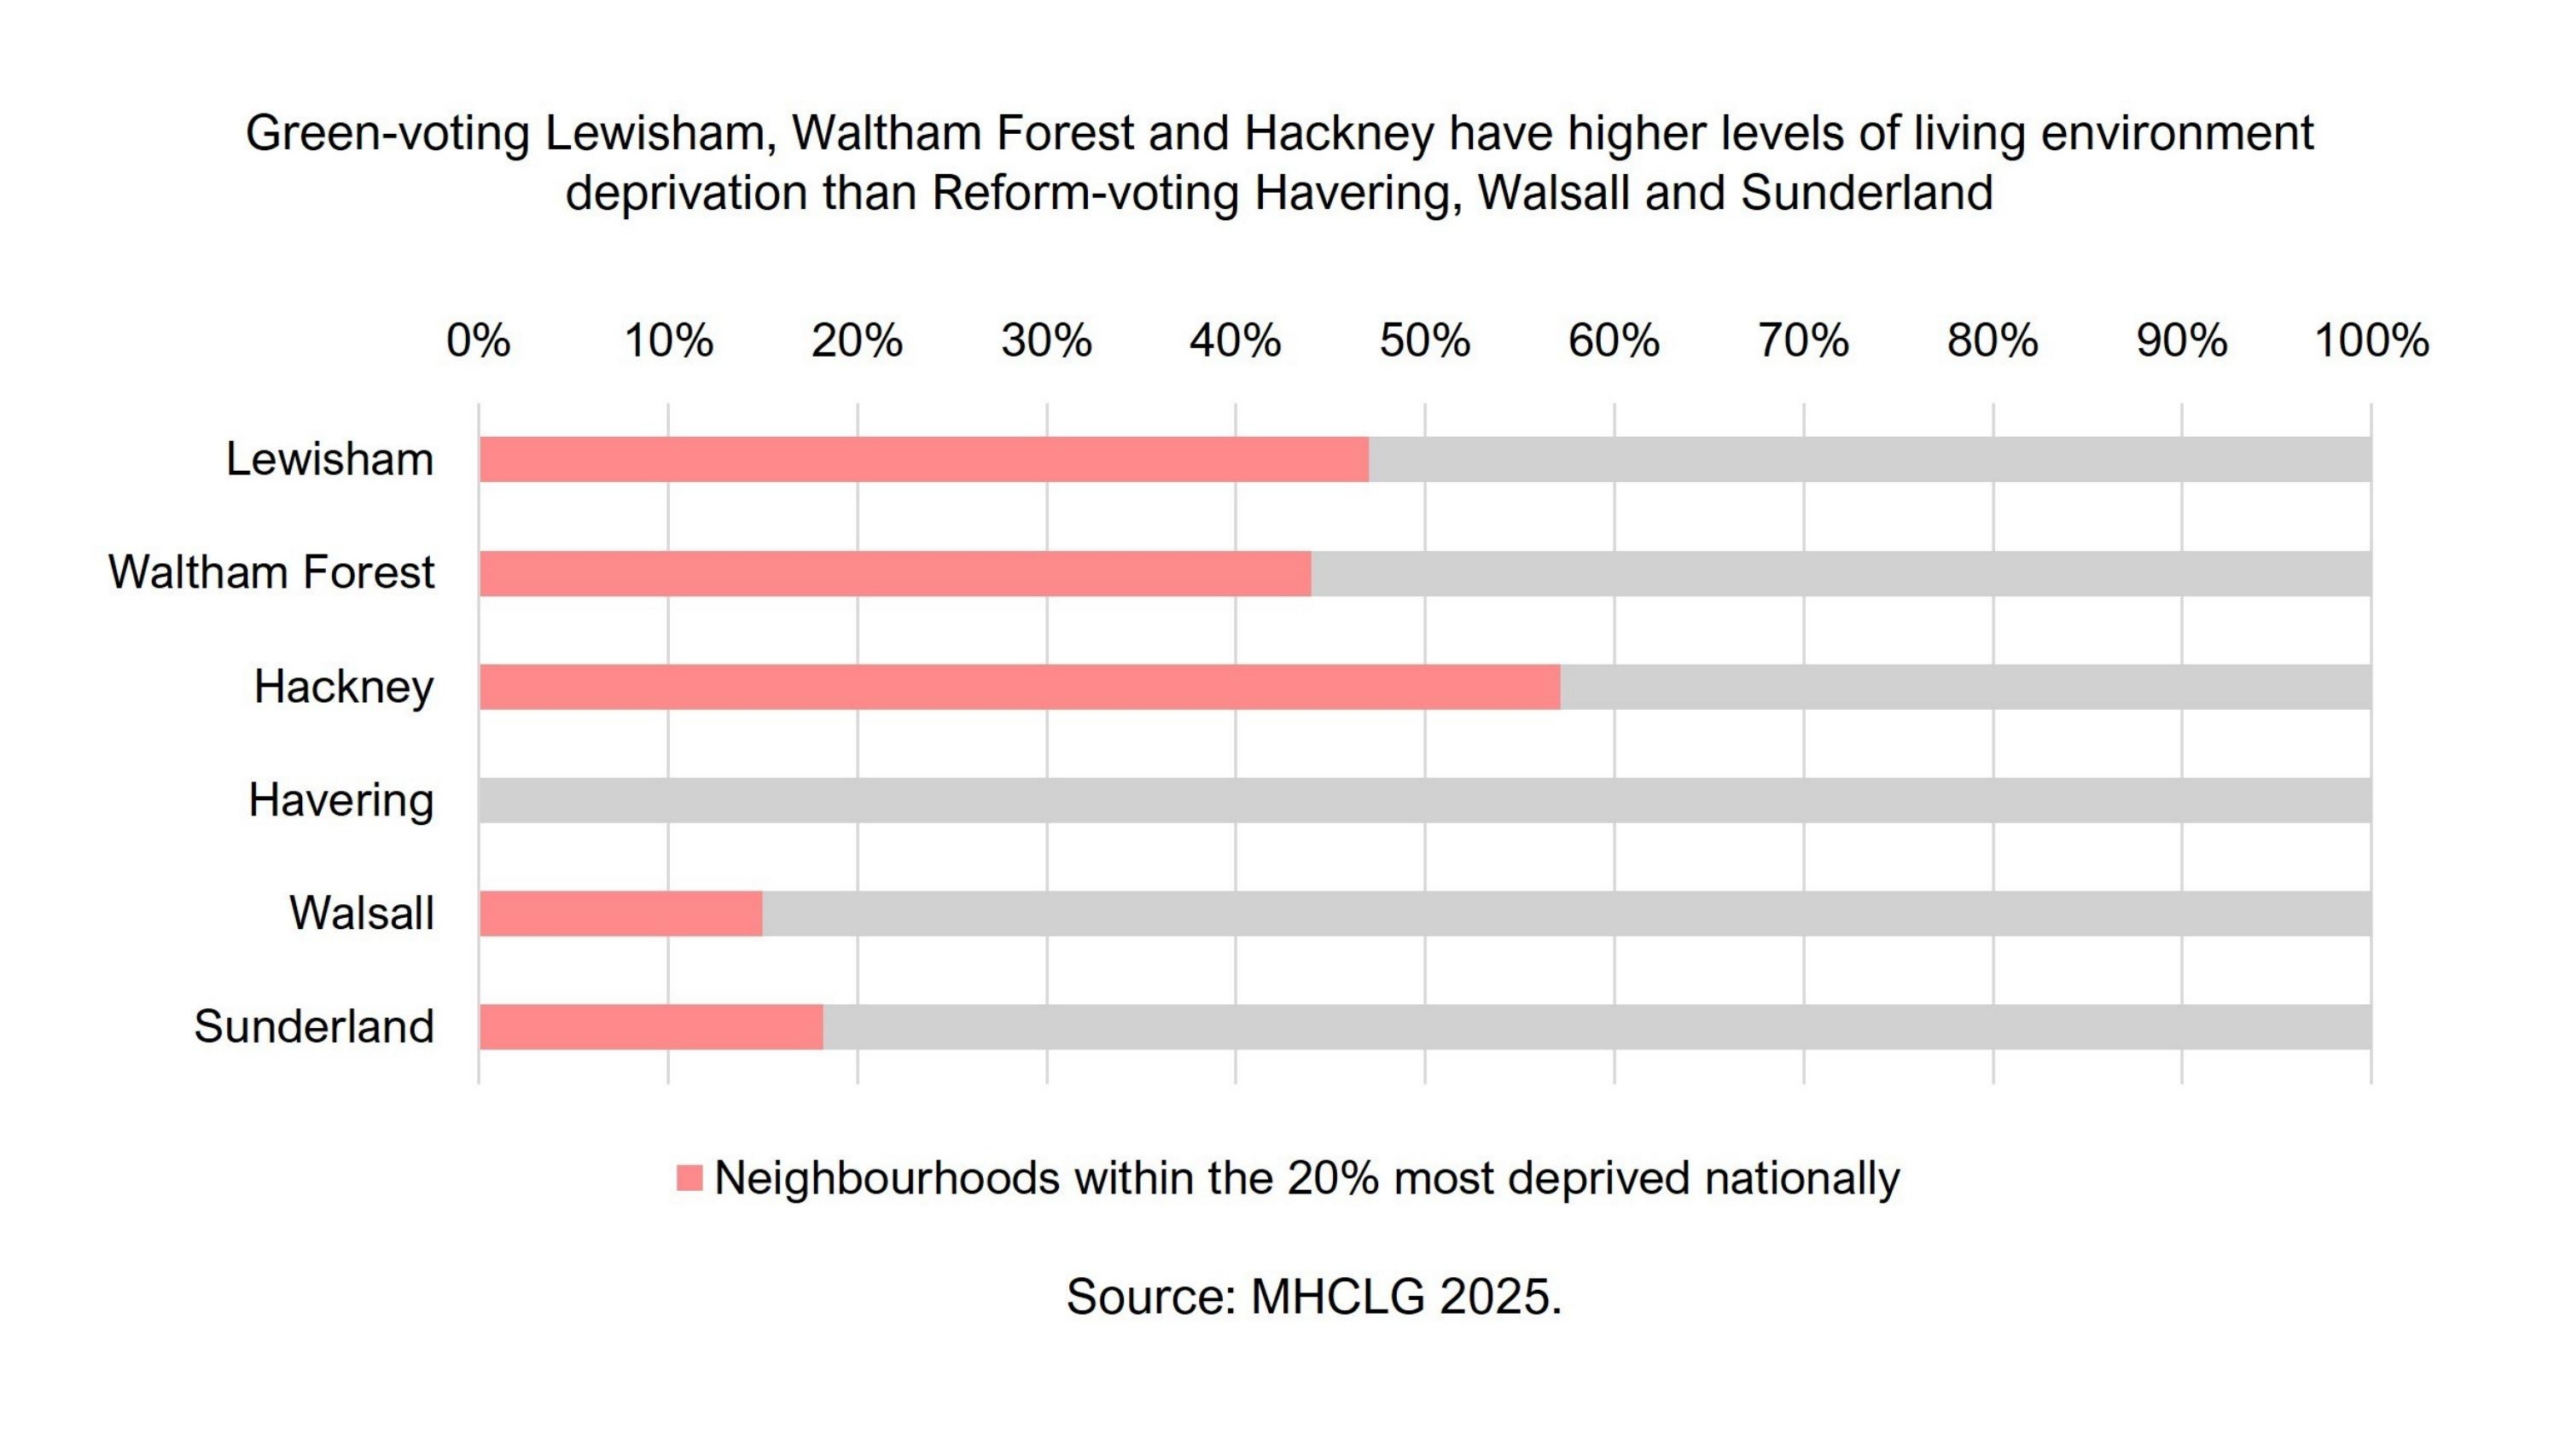
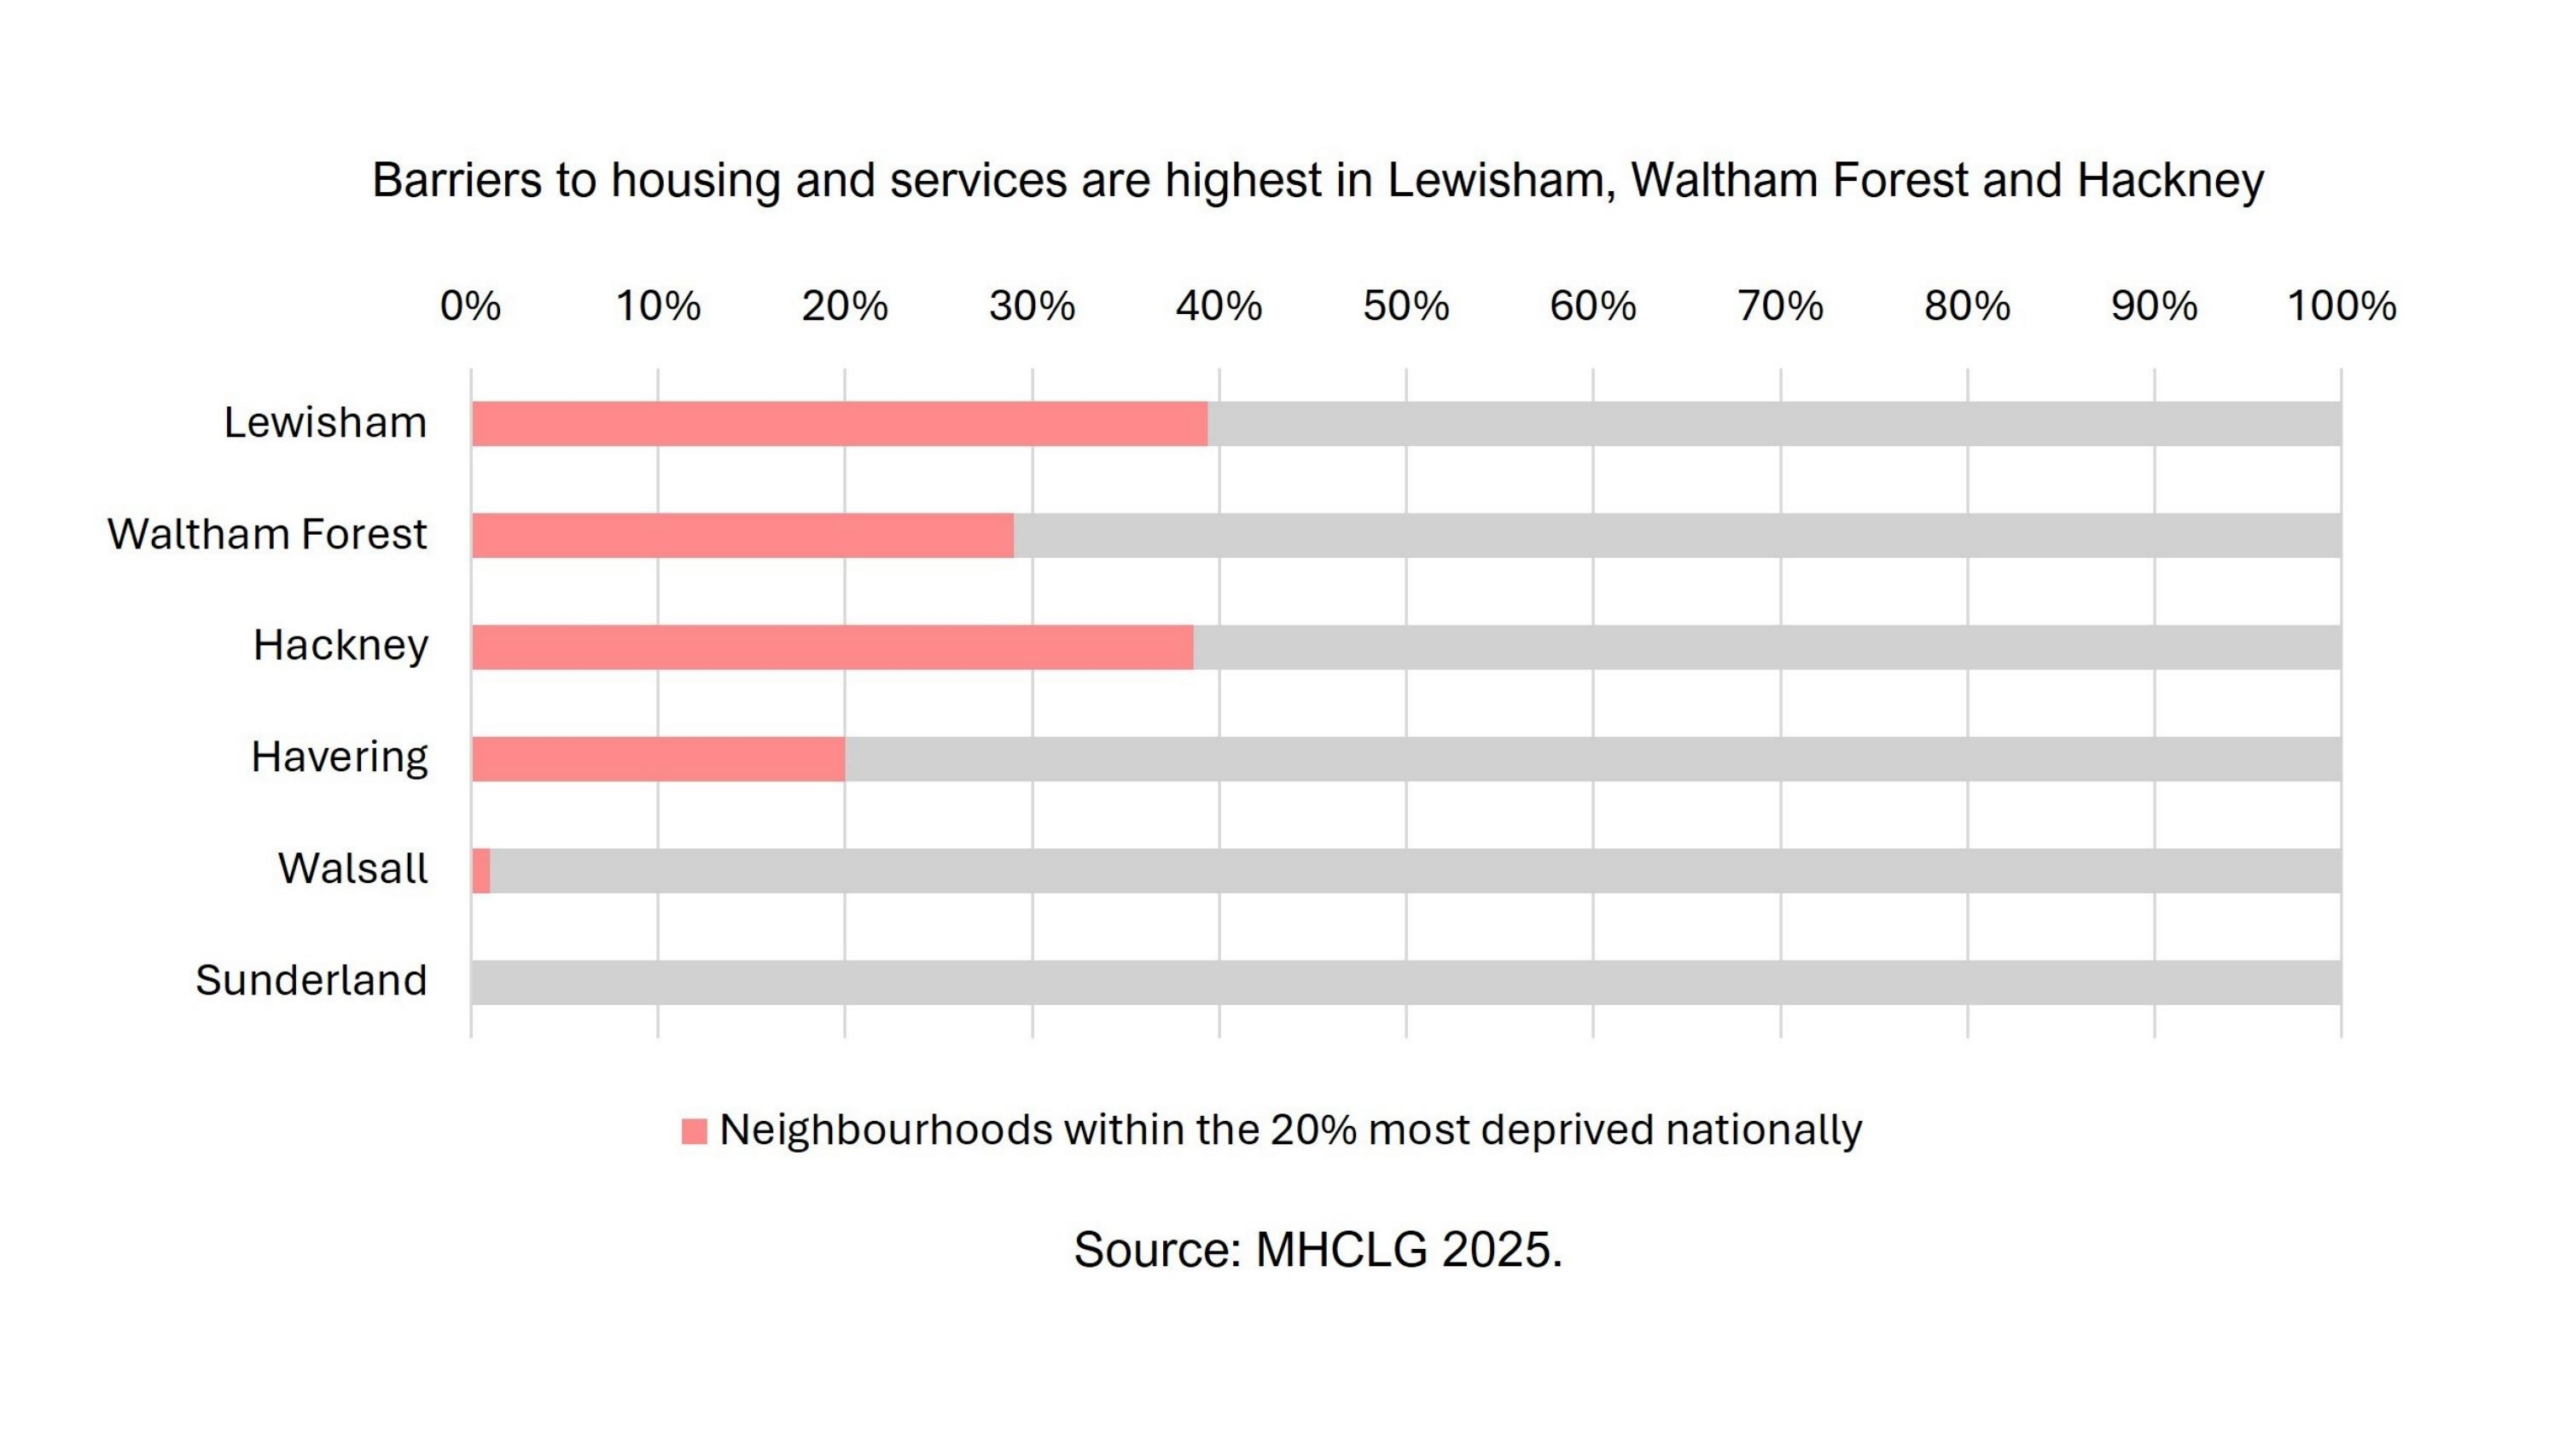
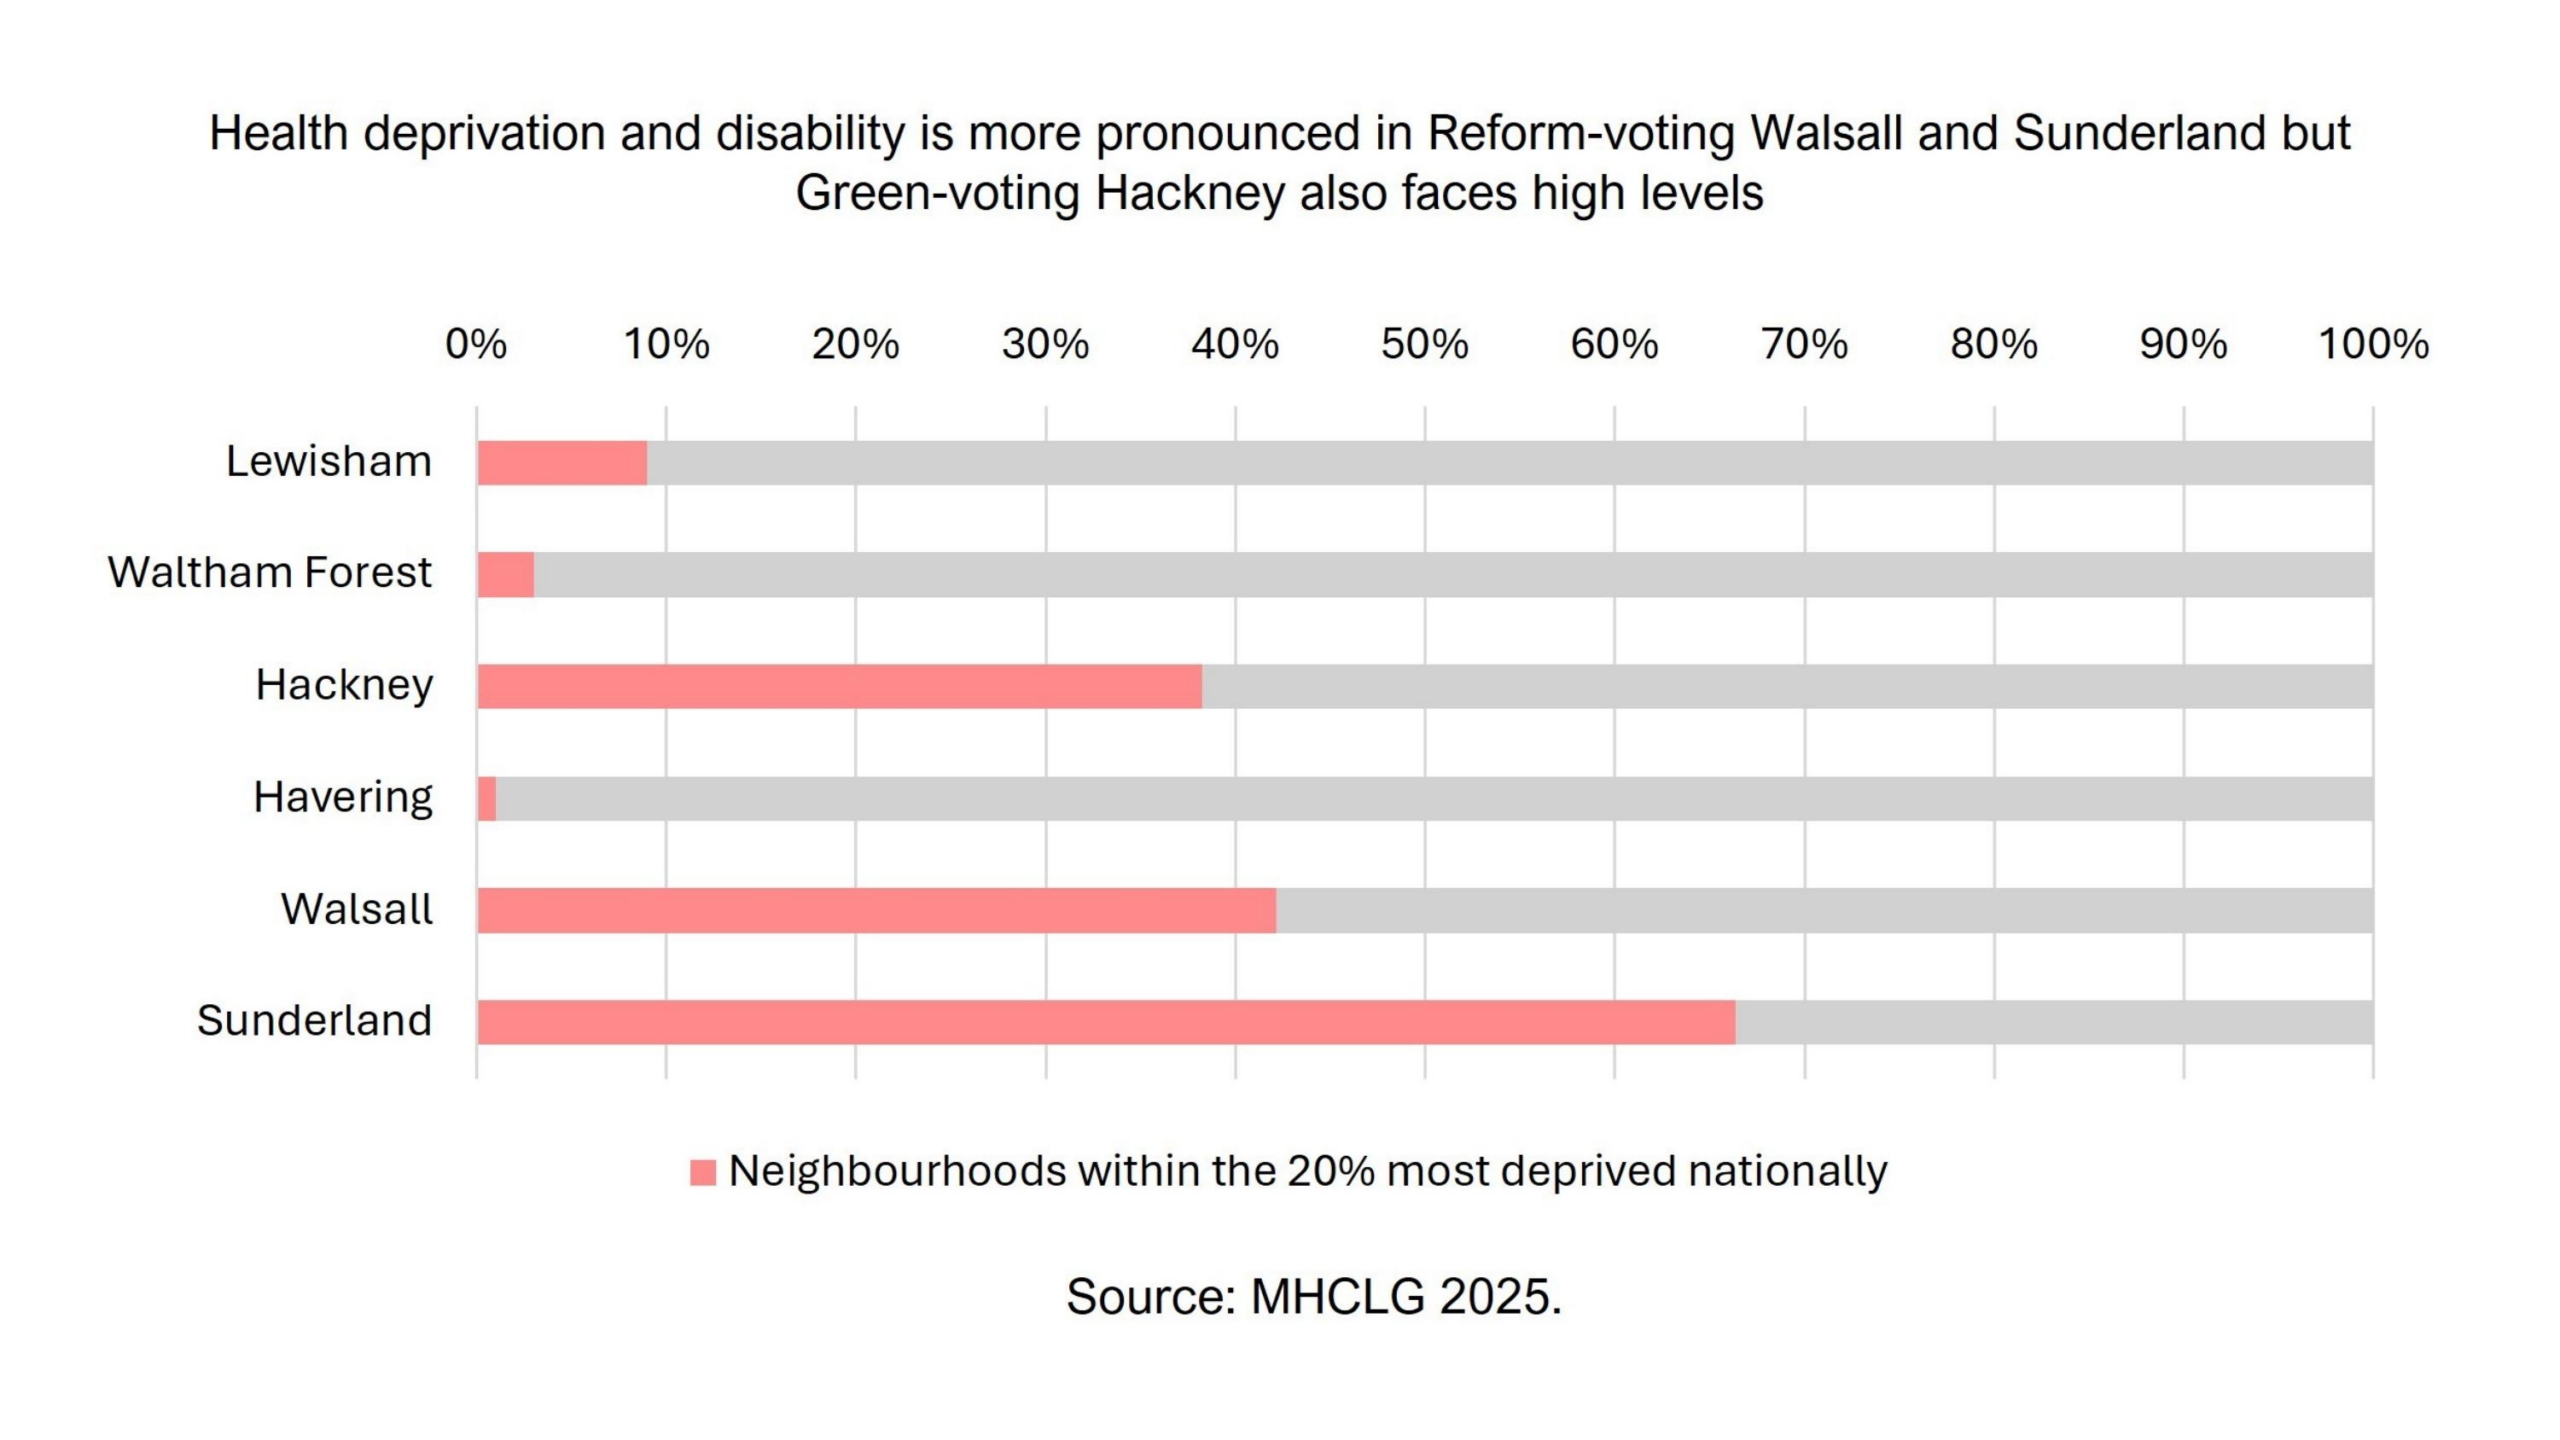
Taking our case study areas which represent local authorities across the country that won outright Green or Reform council majorities in the May 2026 elections, we see that areas that went Green have higher levels of environmental and housing and services deprivation, while areas that went Reform have higher levels of health deprivation and disability. Note that Havering is an outlier: as the easternmost London borough, it has many of the benefits of being in a big city in terms of access to jobs and services, but with lower levels of housing and environment deprivation. Havering shows how much culture and identity – in this case, ties to Essex – matters to voters, not just material conditions.
Reform-voting areas have stark inequality within the borough
Another difference between our case study boroughs is that Reform areas have particularly striking gaps between the most and least deprived local authorities. Reform-voting Sunderland and Walsall have a high proportion of the most and least deprived areas, which is why you can see pockets of red and blue. This aligns with wider research that has found that 17 of the top 20 local authorities with the largest deprivation gap between neighbourhoods are urban areas in the North or the midlands.
![[Left] A map of Sunderland showing the IMD decile by small area, from dark red (most deprived) to blue-green (least deprived). Highly deprived areas are concentrated in the north east and the south. The map shows stark inequality, with some of England's most and least deprived neighbourhoods in close proximity. [Right] A map of Walsall showing the IMD decile by small area. The west is highly deprived while east contains some of the east deprived neighbourhoods.](https://prdweb.co.uk/wp-content/uploads/2026/06/map_pair_1_sunderland_walsall_IMD_updated-scaled.jpg)
If you compare these areas to Green-voting Hackney and Lewisham, you can see that deprivation – while high, especially in Hackney – has less stark differences between the highest and lowest areas of deprivation.
![[Left] A map of Hackney showing the IMD decile by small area. Most of the borough is shaded in mid-range oranges and reds, indicating high but relatively evenly distributed deprivation — unlike the stark polarisation seen in the Reform-voting boroughs. [Right] A map of Lewisham showing the IMD decile by small area. Deprivation is spread in a relatively even pattern across the borough.](https://prdweb.co.uk/wp-content/uploads/2026/06/map_pair_2_hackney_lewisham_IMD-scaled.jpg)
Different domains of deprivation are driving voters within boroughs to different parties
Research has shown that boroughs that went Reform or Green in the May 2026 elections experience higher levels of deprivation compared to other boroughs. But do we see this pattern within boroughs?
Mapping voting outcome by domain of deprivation in our six case study areas, we see that voting patterns within a borough are often linked to deprivation.
Health deprivation in Walsall is linked to voting for non-mainstream parties, while in Waltham Forest, the areas with the best health outcomes voted Conservative or Labour
In Walsall, Reform and independents did better in wards containing the top 20% highest health deprivation, while the Conservatives did better in wards with lower levels of health deprivation. This aligns with research showing that Reform tends to overperform in constituencies with high levels of health deprivation. In Waltham Forest, the areas with the lowest levels of health deprivation – mainly in the north of the borough – went Conservative or sometimes Labour, but never Green.
![[Left] A map of Walsall showing ward-level May 2026 local election results overlaid with areas in the top 20% most deprived nationally for health. Areas of high health deprivation are concentrated in Reform-voting and independent-voting wards in the centre and south, while Conservative-voting wards in the east have lower health deprivation. [Right] A map of Waltham Forest showing ward-level May 2026 local election results overlaid with areas in the least 20% most deprived nationally for health. Most wards voted Green. Northern wards — with lower health deprivation — tended to vote Conservative or Labour.](https://prdweb.co.uk/wp-content/uploads/2026/06/map_pair_3_walsall_walthamforest_health-scaled.jpg)
In Hackney, wards with low levels of education deprivation voted Green, while in Walsall, areas of high educational deprivation voted Reform or independent
In Hackney, the wards with the lowest levels of education deprivation tended to vote Green, while in Walsall, wards with a high concentration of education deprivation went Reform or independent. This aligns with research showing that places with high levels of education deprivation are more likely to back Reform.
![[Left] A map of Hackney showing ward-level May 2026 local election results overlaid with areas in the top 20% least deprived nationally for education. Almost all wards voted Green, and areas of low education deprivation almost exclusively voted Green. [Right] A map of Walsall showing ward-level May 2026 local election results overlaid with areas in the top 20% most deprived nationally for education. Reform and independent candidates won most wards, and areas of high education deprivation are spread across Reform and independent-voting parts of the borough.](https://prdweb.co.uk/wp-content/uploads/2026/06/map_pair_4_hackney_walsall_education_updated-scaled.jpg)
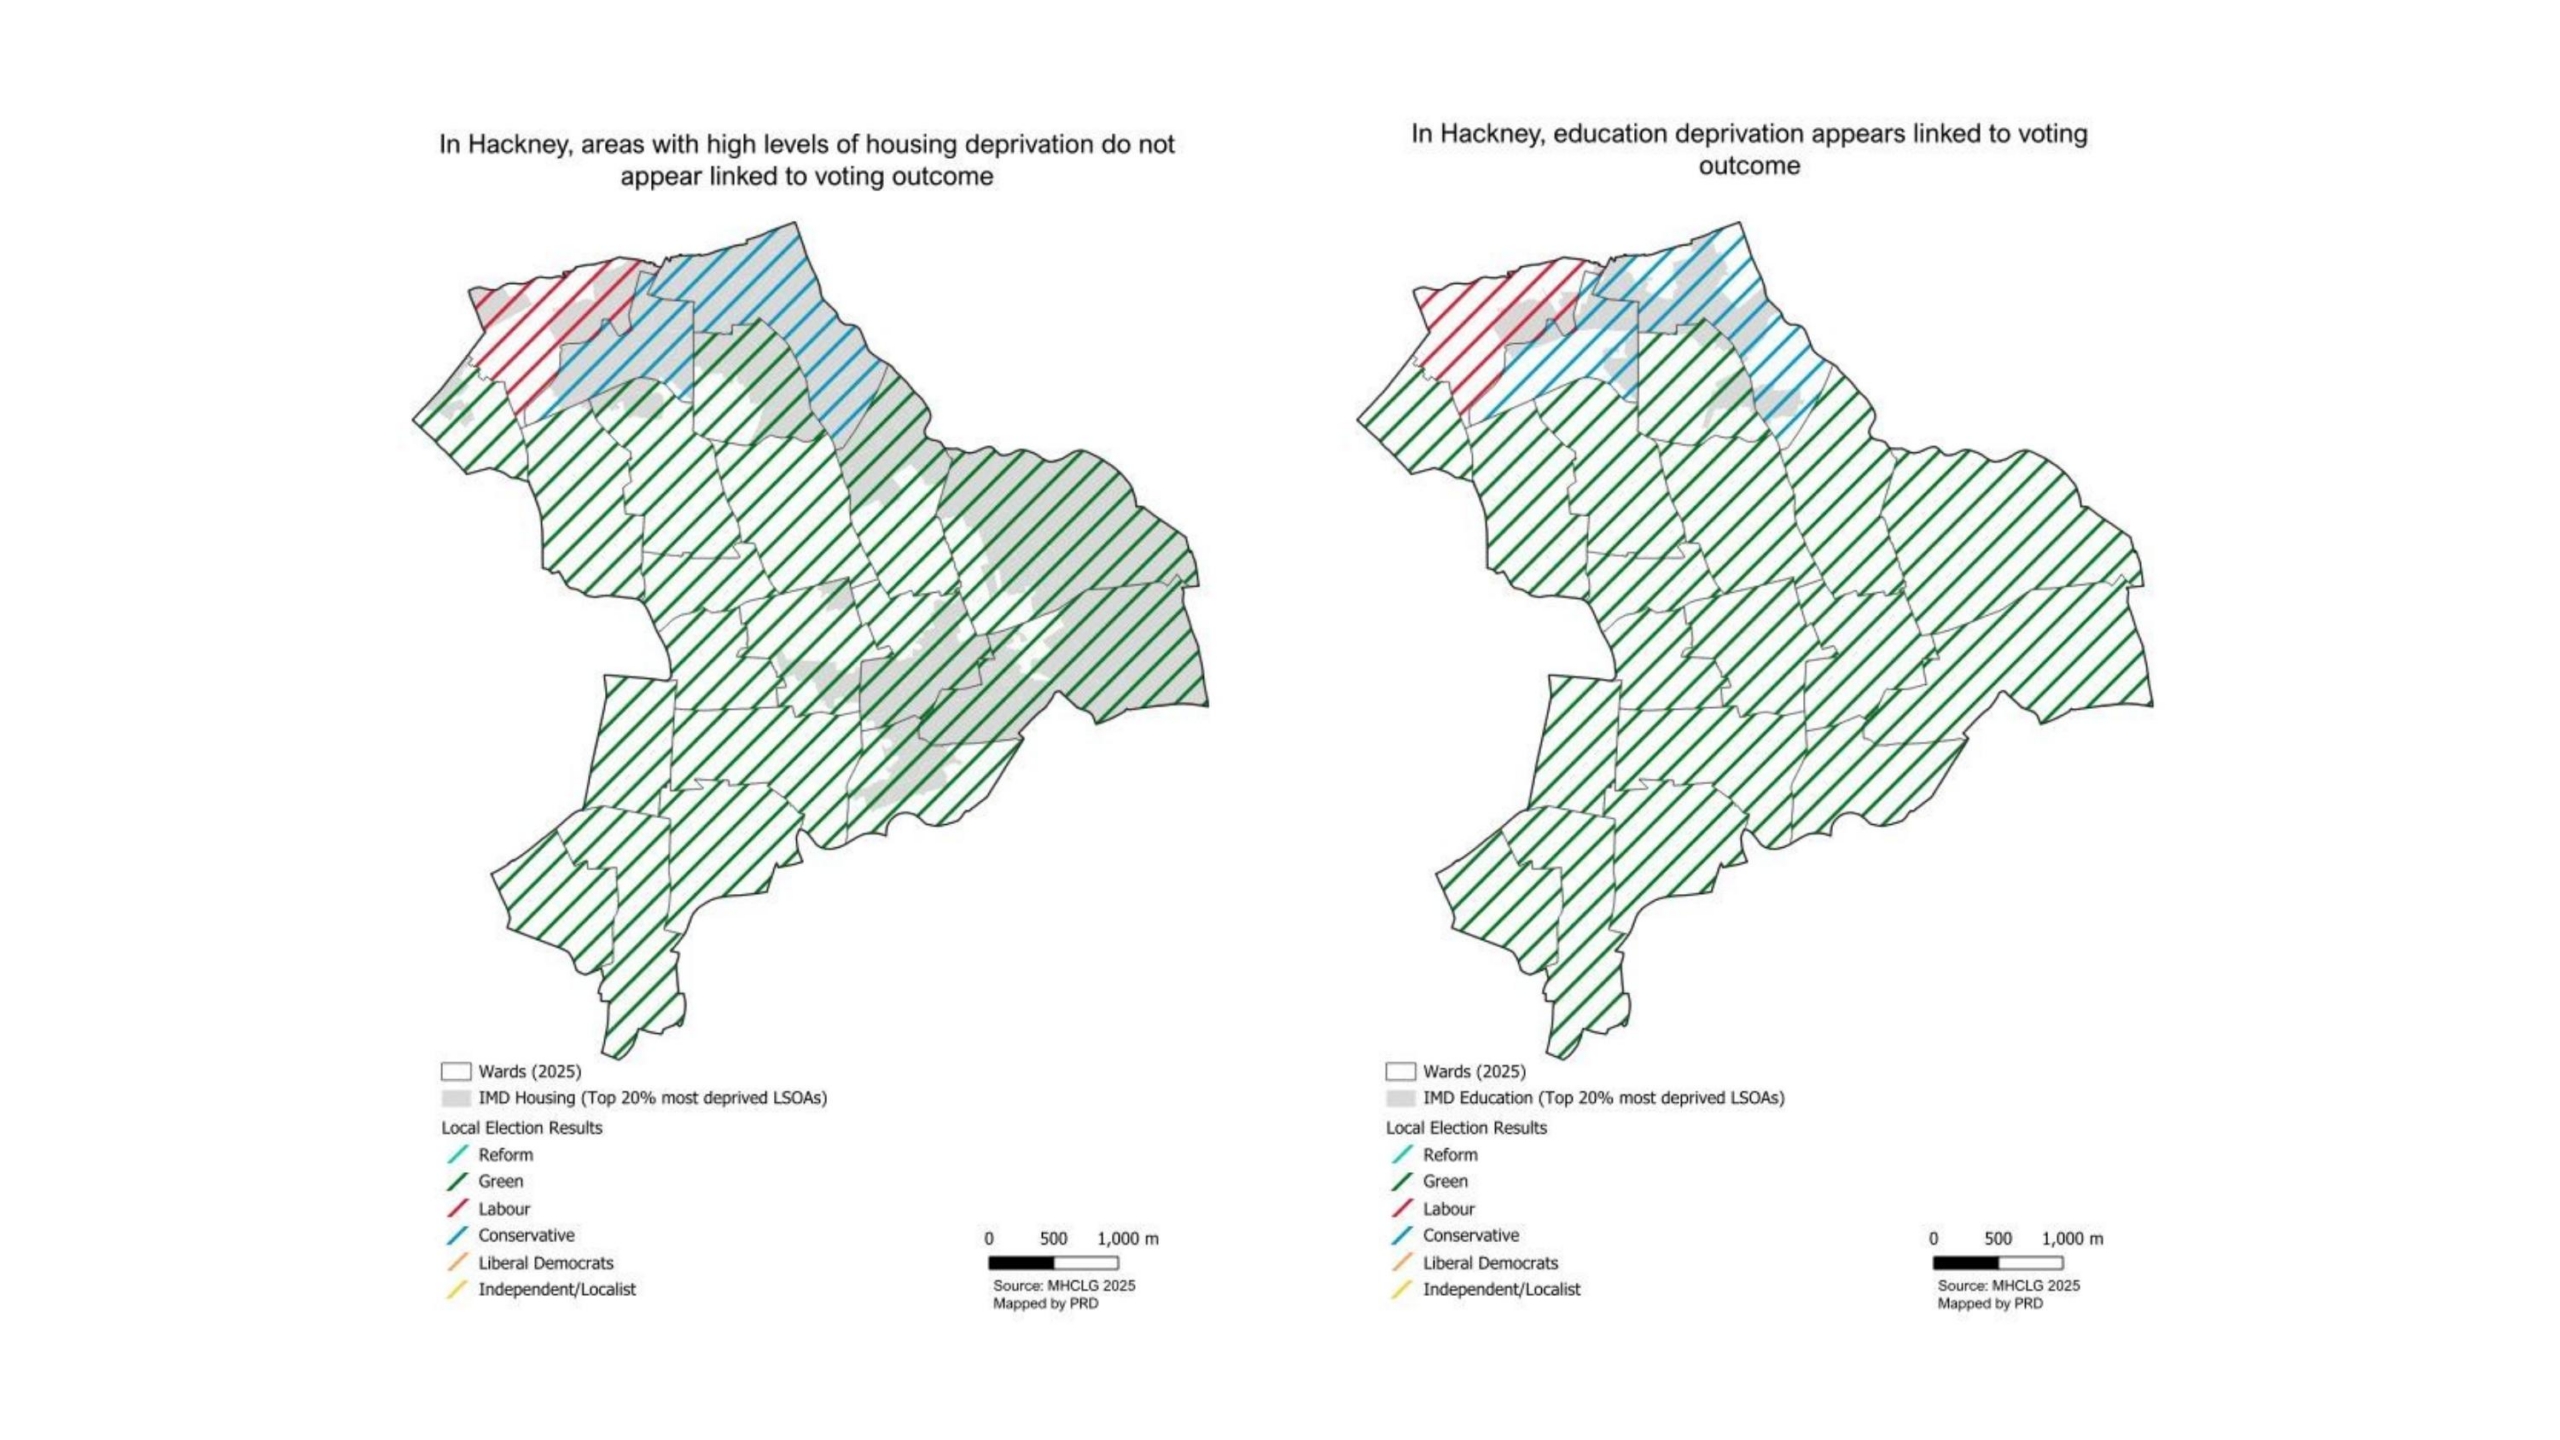
Within Hackney, housing deprivation doesn’t seem linked to voting patterns, but education deprivation does
In Hackney, wards that voted Conservative or Labour tended to have high levels of education deprivation compared to the rest of the borough that went Green. While education deprivation was linked to voting patterns in Hackney, housing deprivation does not appear to have the same strong link to voting outcome that we might expect: we don’t seem to see the same correlation at a hyper-local level in Hackney between housing deprivation and voting patterns that we see at a borough level.
What does this mean?
There are two key takeaways from our mapping. First, deprivation within boroughs, not just between boroughs, is often linked to voting outcomes, as we saw connections between health and education deprivation and voting for non-mainstream parties. While there are many cases where deprivation doesn’t neatly map onto voting outcome – housing deprivation in Hackney being a prime example – lots of the patterns on voting and deprivation observed between boroughs also appear within boroughs in our case study areas.
The second key takeaway is that in our case studies, the Reform-majority areas had stark levels of deprivation side by side with affluence. This aligns with political analyst Chris Clarke’s “behind the glass” theory that the areas pushing hardest for political change are places where inequality is most visually evident. We often talk about visible inequalities being a problem in big cities – Tower Hamlets being an obvious example – but our mapping shows that Sunderland and Walsall contain some of the most and least deprived areas side by side, and these places hold voters who want radical change.
Taken together, these two findings lend weight to wider research showing that different forms of deprivation are pushing voters towards parties at opposite ends of the political spectrum. Those turning to the Greens are often facing high levels of environmental deprivation: unaffordable and poor-quality housing, polluted neighbourhoods, difficulty accessing a GP. Those voting Reform are facing deprivation of life chances – low educational attainment, poor health and a lack of quality work – all of which are barriers to finding and sustaining good work.
We need to build stronger communities, as well as a stronger economy
Voting and deprivation vary on a hyper-local level and areas close to one another can have very different presentations of deprivation that require different responses. As each place is unique, there is no single strategic or delivery takeaway for local authorities in tackling deprivation of life chances or of living conditions.
That said, the takeaway that does cut across every local authority is that the 2026 May elections were yet another sign that this country has become intensely polarised. There is a real risk that we not only disagree with each other, but we cannot understand where others are coming from. And there is a particular risk that, when neighbours sit at either end of the deprivation scale, they become unknown to each other: moving in different spaces, going to different shops, different schools, different pubs and bars.
One of the best solutions for this is for local authorities to support what sociologists call “bridging capital”, which is social capital that creates stronger ties across different groups. Stark inequality weakens community bonds and social capital – both of which are essential for economic flourishing and social mobility.
There are proven positive links between social capital and social mobility, employment prospects, health and wellbeing, children’s development, crime reduction and more. Areas with high levels of deprivation require not just economic action but community action to create places and networks that everyone participates in, like clubs, associations and volunteer groups. Strong community networks improve social capital and in doing so, reverse a cycle of social isolation and material deprivation.
The government’s Pride in Place Strategy sets out to tackle this, explicitly highlighting the importance of strong social capital, and trust in particular, to improving living standards and outcomes all round. The £175m Community Wealth Fund in particular is designed to help places facing high deprivation and low social capital by giving communities power to spend money on what they identify as needing, such as after-school clubs and employment support.
While these formal, government-funded spaces matter hugely to rebuilding social capital, local and national governments and combined authorities should also look at how to create the conditions for social infrastructure to blossom outside of government support. The Independent Commission on Neighbourhoods’ research has shown that deprived neighbourhoods have around 25% less social infrastructure amenities, such as pubs, cafés, gyms and social clubs compared to affluent neighbourhoods. Rebuilding a range of third spaces run by businesses, the public sector and community organisations is key to creating the social infrastructure that supports social capital.
Action to improve economic development and public services will be essential to tackling voters’ very real concerns, but action to improve local social networks is also an important and overlooked part of the story.