Can Londoners afford London? Tracking the true cost of living across the capital
Today, PRD is launching a new Cost of Living Calculator for London, following the first edition published in 2022. Our calculator sheds light on how much money households have left over after essential expenses and how disposable income varies by borough.
Since launching our original Cost of Living Calculator, talk of high prices has hardened into more systemic concerns about the economy and living standards. The winter of 2022 saw an extreme economic shock, with huge swings in energy prices and major stresses on supply chains. While inflation has fallen from the 2022 highs of 9.4%, we’re all now living at a higher baseline with more expensive services and higher housing costs.
The high cost of living is everywhere, from the number of adults reporting increased living costs to the fact that more than 1 in 5 people in the UK live in poverty. Overall levels of food insecurity in London are higher than in the rest of the country. Food insecurity is particularly high among households with three or more children, with more than a quarter of these households living in food insecurity as of 2023/24.
By updating the Calculator for 2026, we hope to improve the understanding of the true cost of living across London’s 32 boroughs and to identify the key opportunities for action. We envision the calculator being used predominantly by councils to make targeted interventions by uncovering what true affordability looks like for residents across various tenure types, occupations, and household compositions. But it may also be useful for developers, housing associations, architects, the civil society sector and community groups – and we’re keen to hear from people who use it.
Why focus on London?
In 2022, our argument for focusing the Cost of Living Calculator on London was that poverty is one of the city’s most defining challenges. That remains true today.
More than two million people in London are living in poverty, and over half of them are in work. As well as low pay, many Londoners are battling with precarious contracts and insecure hours.
Housing is also a key driver of rising costs. Since 2022, the average private rent in London rose from £1728/month in January 2022 to £2265/month in October 2025, a 31% increase. Although rent inflation in the city has slowed down from the peak of 11.5% in November 2024, the cumulative increases have built up, and London remains by far the most expensive region in the UK to rent privately.
Modelling the impact of the cost of living crisis on Londoners
We have come up with six fictional households across different London boroughs who have a mixture of jobs, responsibilities, living arrangements, tenures and ages. We have then estimated their incomes and essential outgoings to see how much money, if any, they would have left over once their basic needs were met. These households are not intended to perfectly represent the demographics of the city, but to give a flavour of different financial situations.
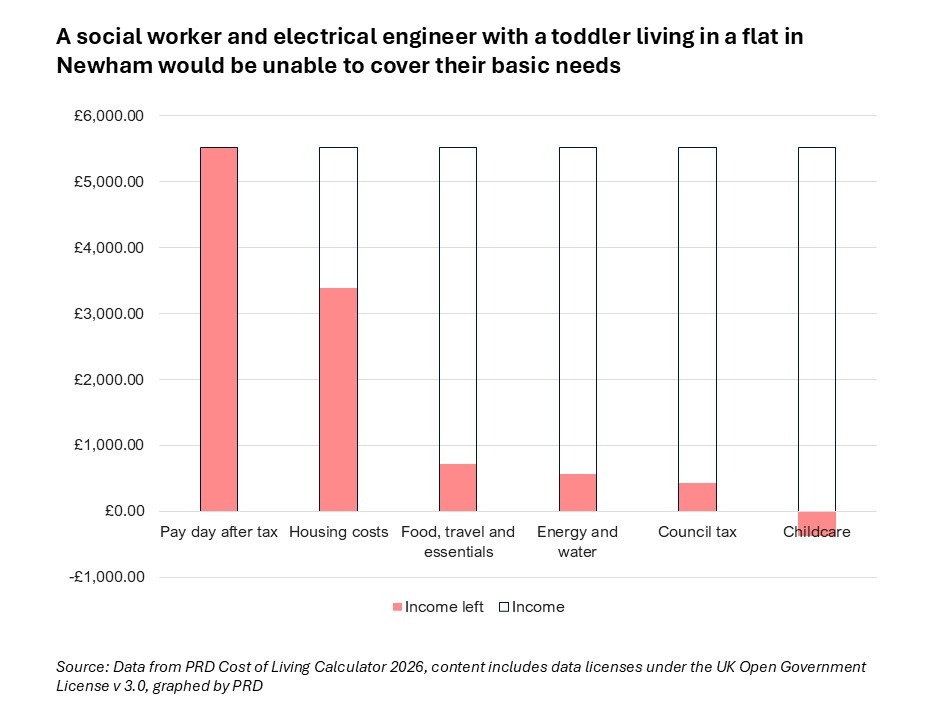
Jamal and Julie – a young family living in the London Borough of Newham
Jamal (31) and Julie (33) are renting a two-bedroom flat with their three-year-old son, Jack. Both work locally – Jamal as a social worker and Julie as an electrical engineer – so Jack goes to a nursery full-time. Even with two parents working full time, the cost of childcare tips Jamal and Julie into the red every month and the couple are left with no money for savings or unexpected costs.
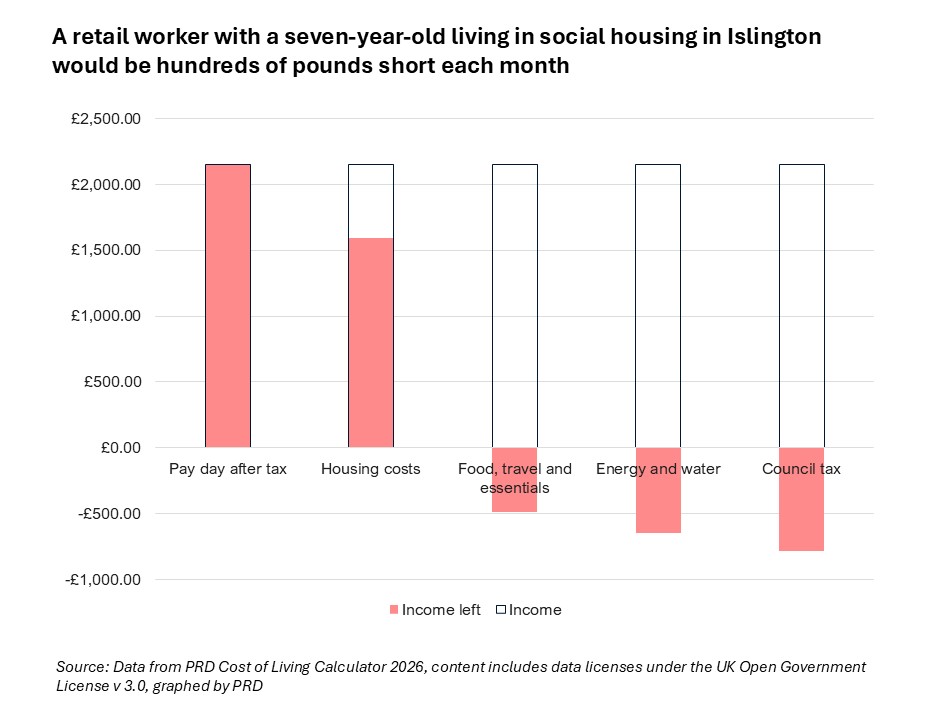
Lucy – a single mum living in social housing in the London Borough of Islington
Lucy is a 40-year-old single mum living in a one-bedroom social housing flat. She works full-time in retail and manages to avoid childcare costs as her mother looks after her seven-year-old son Leo, after school when Lucy is at work.
Despite having lower than market rent and no childcare costs, Lucy’s income alone leaves her about £750 a month short of what she needs to cover the basics for her and her son.
Emina – a civil servant living with housemates in the London Borough of Hammersmith & Fulham
Emina is a 33-year-old junior civil servant privately renting with her two housemates, Ahmed (30), who is training to be a solicitor, and Orlando (28), who works in marketing. Emina lives in LB Hammersmith & Fulham and commutes to Whitehall.
After taxes, rent, food, travel and essentials and bills, Emina has a few hundred pounds of disposable income every month. Most of this she tries to put into savings and the occasional holiday, although recently she has been sending money to her parents as they’ve been struggling financially.
She’d like to own her own home at some point, but, in her current circumstances, she knows that she is years away from being able to afford to do this in London. Average prices for a one-bed flat in Hammersmith and Fulham are £528k. It would take Emina more than 17 years to save up for a 10% deposit at her current rate of saving £250 a month.

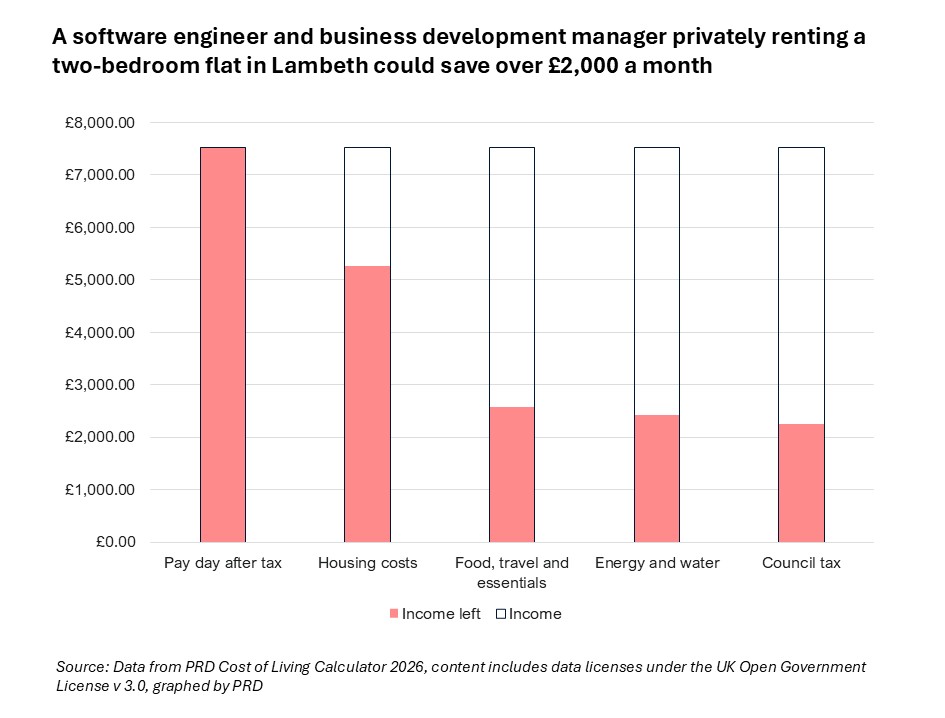
Sam and Charlotte – private renters in a two-bedroom flat in the London Borough of Lambeth
Sam and Charlotte are a couple privately renting a two-bedroom flat. They are both 27 years old. Sam works remotely as a software engineer, and Charlotte is a business development manager. They are better off than our other households financially, mostly because they have a much higher post-tax joint income (over £7,000), and they have no childcare costs. After all the necessities, Charlotte and Sam are able to save over £2,000 a month.
Josh and Tahsin – a family with teenagers in the London Borough of Waltham Forest
50-year-old Josh and 49-year-old Tahsin are a couple living with their two teenage children, Leila and Nadia. After years of living at home with Tahsin’s mum, Josh and Tahsin managed to save up for a deposit to get a mortgage on a two-bed maisonette in Waltham Forest. Tahsin works in IT while Josh works part-time as a tennis coach. Our calculator finds that after all essential costs, this household has around £100 left over each month.

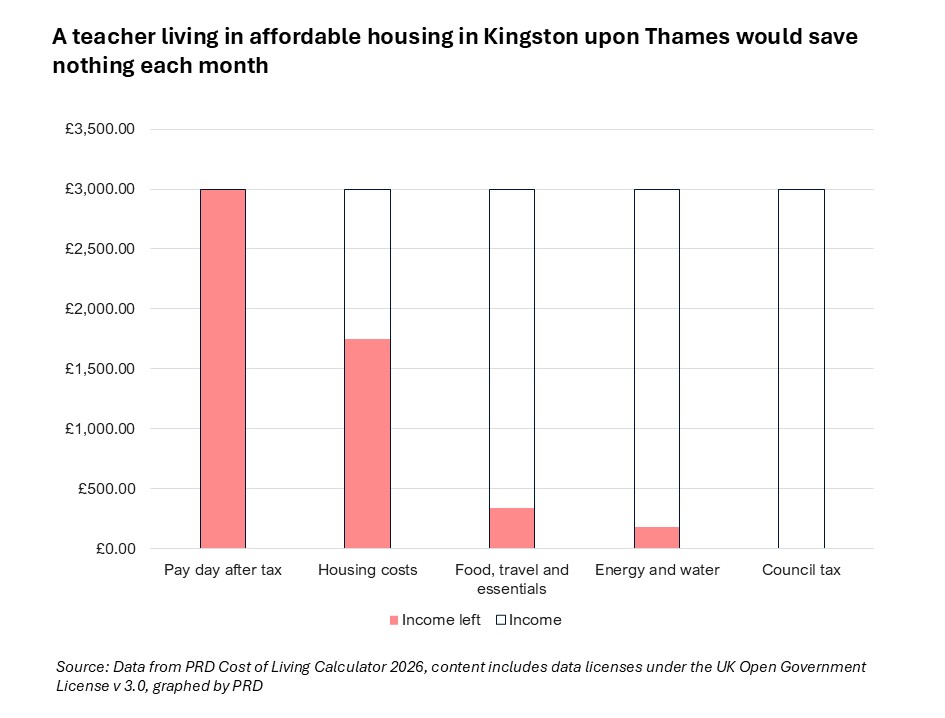
Tom – a teacher living alone in affordable housing in the Royal Borough of Kingston upon Thames
52-year-old Tom lives alone and works full-time as a secondary school English teacher, having retrained after a career as an accountant. Tom is entering his fifth year of teaching now and earns £45,000. Many teachers cannot afford to live in London, and Tom was only able to accept the position at the school in Kingston because he was offered affordable housing at 80% of market rent. Even with reduced rent, Tom earns just enough to cover his basics but is unable to save anything.
Opportunities for action
Our Cost of Living Calculator clearly shows that many working households – even those with stable and secure jobs – are struggling to make ends meet. The three main stresses on households are low wages, high housing costs and high childcare costs. So how can local areas take action?
Wages
Since 2022, rising prices have eroded disposable incomes. In the UK as a whole, average wage growth between 2022-2024 hovered around 5-6%, where inflation outpaced wage growth by 2-3 points annually. This has resulted in a cumulative real wage decline of 15-20% over those two years.
The impact for lower income Londoners is bleak. Those in the 10th percentile, earning less than 90% of other Londoners, have annual pay that is 9% less than it was in 2008. It’s no surprise that our analysis finds that low-earner households – Lucy, working in the foundational economy, or Jamal and Julie, in the public sector – are struggling the most.
Good practice examples:
- Southwark’s Living Wage Campaign has promoted the London Living Wage in the borough, encouraging local businesses to become accredited Living Wage Employers. Over three years, the council has almost doubled the number of local businesses paying their staff the London Living Wage.
- The City of London’s GROW Employability Project supports people to enhance their employment opportunities by offering one-to-one support on finding training, applying for jobs and doing interviews. The project offers guidance around careers in specific sectors including the NHS, customer service, warehousing and construction. The aim is to support residents into work or new careers, or to get promoted.
Cost of renting
There is no single determinant of private rents and house prices and therefore no single lever to pull to make housing more affordable. However, what is clear is that to improve affordability, there should be a strong focus on private renters, who are less protected from rising housing costs than those living in social housing and those with a mortgage.
In London, rental inflation has significantly slowed down since 2022. The city has seen annual rent inflation fall to less than 2% – below the UK average and far below the peaks of 11.6% in the year leading up to November 2024. While the recent slowdown in rental increases is a welcome relief, private rents are still eating away huge chunks of residents’ income, with tenants now spending an average of 41.6% of their income on rent in London. Last year, a private rental tenancy ending was by far the most common reason households in the capital were owed a prevention duty by their local authority.
Housing delivery is critical to making all types of housing more affordable, and there’s clearly a need for more innovative models of both housing delivery and housing typologies. Intermediate products (including shared ownership, part-buy schemes and discounted market rents) offer a potential solution to the high costs of private rents, but they are not currently widely accessible for Londoners. Currentl,y there is so little availability that most people do not consider intermediate housing as an option and many people – particularly middle-earning dual-income households – do not meet the eligibility criteria.
Good practice examples:
- Hackney’s Intermediate Housing Panel was set up to explore whether intermediate housing is a deliverable solution to the housing crisis. Intermediate housing could bridge the gulf between social housing and market rents, providing stable, affordable housing while putting tenants on the path to full ownership. The panel will engage with those interested in intermediate housing in the borough to better understand demand and people’s real-life experience within private-sector housing.
- Waltham Forest’s Affordable Housing Commission and Housing Transformation programme was established so thatindependent experts could advise the borough on how it could accelerate the delivery of genuinely affordable homes. The commission also put an emphasis on prevention, finding ways to stop private renters from becoming homeless through mediation and helping them to claim the benefits they are entitled to. The council’s Housing Sustainment Team have prevented 60 households from becoming homeless in the last year alone – many of which have been supported to stay in the Private Rented Sector.
- Lewisham’s Small Sites Aggregator Pilot aims to develop small, underutilised brownfield sites already owned by councils, such as dilapidated garage sites, for affordable housing. As our previous work has shown, small sites are underused, despite accounting for much of the capital’s developable land. By working with central government and the private sector on overcoming the investment and planning barriers, London Borough of Lewisham should be better placed to make the most out of these sites.
Cost of childcare
Support for childcare in the UK varies by age of the child. Since the introduction of 15 hours of free childcare in 2024 for working parents of children under two, there has been a significant drop in the cost of childcare for eligible families. In London, this reduced the average cost of 25 hours a week of childcare for eligible working parents by 56% in 2024, from £192 to £84.
However, removing government subsidies from the picture, we’ve seen real rises in the cost of childcare, and families who are not eligible for childcare have seen a 10% increase in costs. Childcare costs that are not subsidised by the government are 29% higher in London than England as a whole, and 8% higher in Inner London than Outer London.
Good practice examples:
- Lewisham’s Children and Family information service helps families navigate, and get the most out of, a complex childcare system. The service helps families find a childcare provider, check eligibility and apply for centrally funded childcare entitlements that vary with age, income and work status.
- Tower Hamlets’ Supplementary Planning Document encourages developers to incorporate space for early years education and childcare facilities in developments with demonstrable need. As there is a shortage of nursery places, policies to increase provision of childcare need to tackle both cost and availability.
Conclusion
Our Cost of Living Calculator shows how in-work financial hardship is still one of London’s greatest economic challenges. The tracker is evidence of not just one but many broken social contracts:
- Workers in essential, in-demand jobs, such as teachers and social workers, do not earn enough to pay rent at market levels in the areas where they are needed.
- Full-time, middle-income workers often cannot afford to raise young children without borrowing or going into debt.
- Even those in stable, well-paid jobs are many years away from being able to buy their own home in the city they live in.
Our case studies focused on working households with two children the most. Yet we know that there are many more households – made up of people who are unemployed, or disabled, or who have more children – who will be struggling a lot more.
Effective policies to tackle the unaffordable cost of living need to focus on the underlying drivers of poverty in London, particularly low wages, private rents and childcare.
Next steps
For more insight into using the Cost of Living Calculator and what to do about it in your borough or organisation, please reach out to Will Temple, Rose Jump or Amelia Stewart.